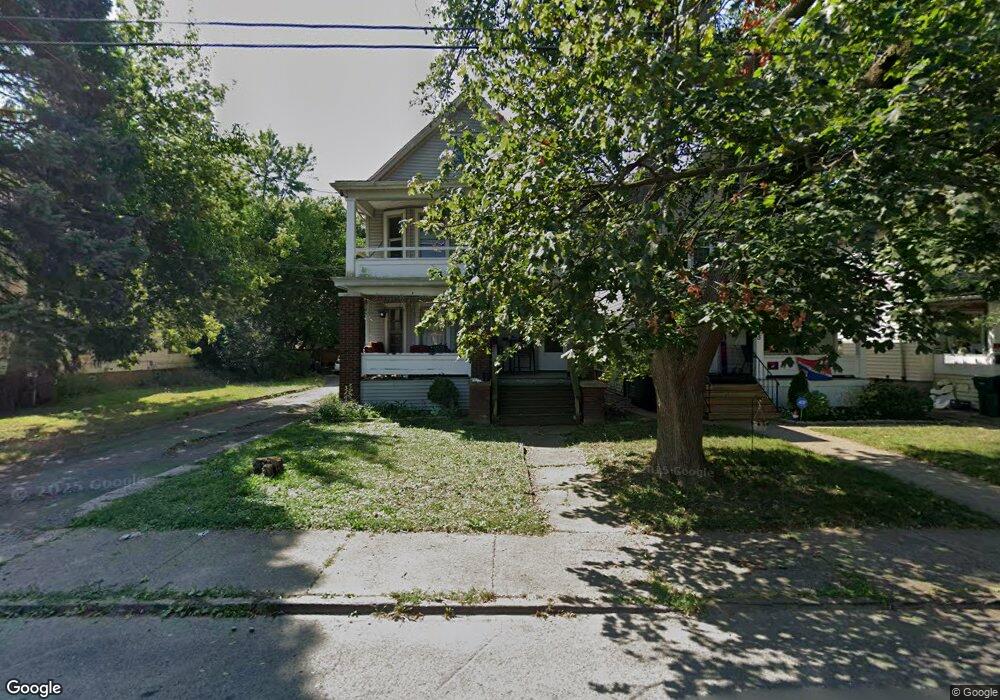
2231 Niagara Ave Niagara Falls, NY 14305
Little Italy NeighborhoodEstimated Value: $105,000 - $145,104
6
Beds
2
Baths
2,368
Sq Ft
$55/Sq Ft
Est. Value
About This Home
This home is located at 2231 Niagara Ave, Niagara Falls, NY 14305 and is currently estimated at $129,776, approximately $54 per square foot. 2231 Niagara Ave is a home located in Niagara County with nearby schools including Niagara Falls High School and St. Joseph Elementary School.
Ownership History
Date
Name
Owned For
Owner Type
Purchase Details
Closed on
Aug 2, 2018
Sold by
Canazzi Caleb Jordan
Bought by
Saenz Mark A and Saenz April J
Current Estimated Value
Home Financials for this Owner
Home Financials are based on the most recent Mortgage that was taken out on this home.
Original Mortgage
$44,250
Interest Rate
4.5%
Mortgage Type
New Conventional
Purchase Details
Closed on
Mar 30, 2018
Sold by
Niagara Falls City
Bought by
Canazzi Caleb Jordan
Purchase Details
Closed on
Jun 14, 2007
Sold by
Plennert Chris Greenawalt M
Bought by
Kistela Mark R Richard H
Purchase Details
Closed on
Apr 20, 2007
Sold by
Wells Fargo Bank Na
Bought by
Plennert Chris
Purchase Details
Closed on
Oct 18, 2006
Sold by
Robin Bevilaqua
Bought by
Wellsfargo Bank
Create a Home Valuation Report for This Property
The Home Valuation Report is an in-depth analysis detailing your home's value as well as a comparison with similar homes in the area
Home Values in the Area
Average Home Value in this Area
Purchase History
| Date | Buyer | Sale Price | Title Company |
|---|---|---|---|
| Saenz Mark A | $64,500 | Chicago Title Insurance Co | |
| Canazzi Caleb Jordan | $17,000 | None Available | |
| Kistela Mark R Richard H | $42,000 | Christopher Mikienis | |
| Plennert Chris | $20,000 | David Boniello | |
| Wellsfargo Bank | $39,950 | Fein Such Crane |
Source: Public Records
Mortgage History
| Date | Status | Borrower | Loan Amount |
|---|---|---|---|
| Previous Owner | Saenz Mark A | $44,250 |
Source: Public Records
Tax History Compared to Growth
Tax History
| Year | Tax Paid | Tax Assessment Tax Assessment Total Assessment is a certain percentage of the fair market value that is determined by local assessors to be the total taxable value of land and additions on the property. | Land | Improvement |
|---|---|---|---|---|
| 2024 | $2,022 | $52,000 | $2,800 | $49,200 |
| 2023 | $2,022 | $52,000 | $2,800 | $49,200 |
| 2022 | $1,521 | $52,000 | $2,800 | $49,200 |
| 2021 | $1,521 | $52,000 | $2,800 | $49,200 |
| 2020 | $1,009 | $52,000 | $2,800 | $49,200 |
| 2019 | $969 | $52,000 | $2,800 | $49,200 |
| 2018 | $1,494 | $52,000 | $2,800 | $49,200 |
| 2017 | $969 | $52,000 | $2,800 | $49,200 |
| 2016 | $3,077 | $52,000 | $2,800 | $49,200 |
| 2015 | -- | $52,000 | $2,800 | $49,200 |
| 2014 | -- | $54,000 | $2,800 | $51,200 |
Source: Public Records
Map
Nearby Homes
- 2228 Cleveland Ave
- 2216 South Ave
- 1889 Ontario Ave
- 1868 Niagara Ave
- 1879 Ontario Ave
- 2215 South Ave
- 1849 Niagara Ave
- 1870 South Ave
- 2210 Weston Ave
- 2210 24th St
- 1852 Ontario Ave
- 2436 Cleveland Ave
- 2431 Ontario Ave
- 1868 Weston Ave
- 1827 Cleveland Ave
- 1824 Niagara Ave
- 1807 Niagara Ave
- 2452 Niagara Ave
- 2456 Ontario Ave
- 2217 Michigan Ave
- 2225 Niagara Ave
- 2237 Niagara Ave
- 2223 Niagara Ave
- 2243 Niagara Ave
- 2221 Niagara Ave
- 2232 Cleveland Ave
- 2236 Cleveland Ave
- 2245 Niagara Ave
- 2240 Cleveland Ave
- 2219 Niagara Ave
- 2224 Cleveland Ave
- 2244 Cleveland Ave
- 2249 Niagara Ave
- 2228 Niagara Ave
- 2213 Niagara Ave
- 2220 Cleveland Ave
- 2248 Cleveland Ave
- 2230 Niagara Ave
- 2214 Cleveland Ave
- 2255 Niagara Ave