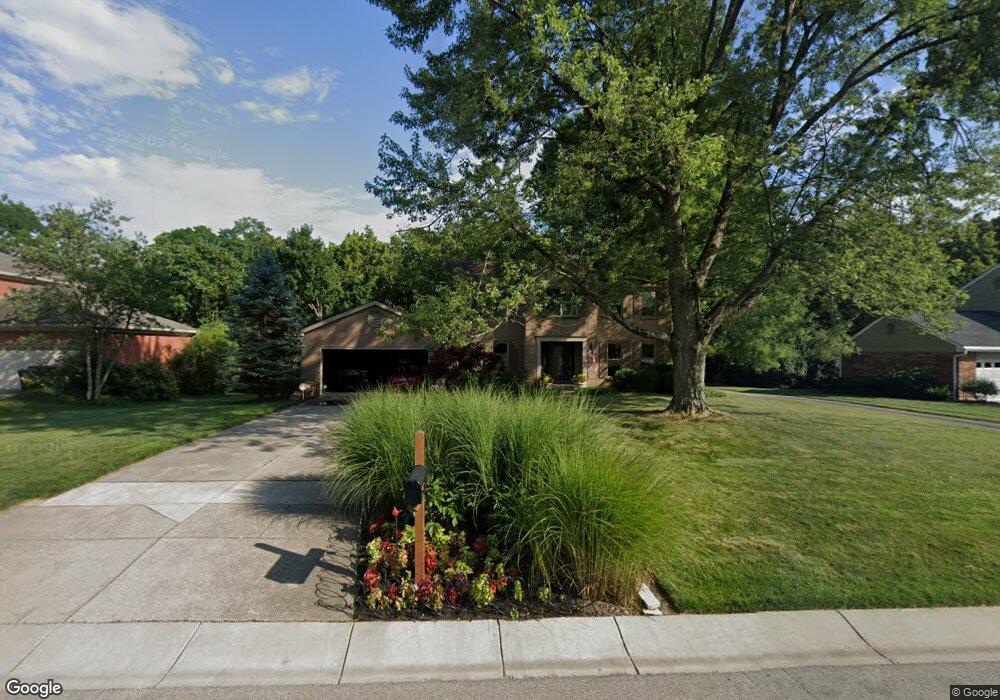
2232 Bretton Dr Cincinnati, OH 45244
Turpin Hills NeighborhoodEstimated Value: $512,000 - $606,000
4
Beds
3
Baths
2,704
Sq Ft
$202/Sq Ft
Est. Value
About This Home
This home is located at 2232 Bretton Dr, Cincinnati, OH 45244 and is currently estimated at $546,077, approximately $201 per square foot. 2232 Bretton Dr is a home located in Hamilton County with nearby schools including Wilson Elementary School, Nagel Middle School, and Turpin High School.
Ownership History
Date
Name
Owned For
Owner Type
Purchase Details
Closed on
Dec 7, 1999
Sold by
Goodfellow Scott D and Robinson Laura A
Bought by
Goodfellow Scott D and Robinson Laura A
Current Estimated Value
Purchase Details
Closed on
Jan 25, 1999
Sold by
Koscielak Richard C
Bought by
Goodfellow Scott D
Home Financials for this Owner
Home Financials are based on the most recent Mortgage that was taken out on this home.
Original Mortgage
$147,200
Outstanding Balance
$31,811
Interest Rate
6.75%
Estimated Equity
$514,266
Purchase Details
Closed on
Jan 21, 1999
Sold by
Koscielak Daniel Martin and Koscielak Michael Derik
Bought by
Koscielak Richard C
Home Financials for this Owner
Home Financials are based on the most recent Mortgage that was taken out on this home.
Original Mortgage
$147,200
Outstanding Balance
$31,811
Interest Rate
6.75%
Estimated Equity
$514,266
Create a Home Valuation Report for This Property
The Home Valuation Report is an in-depth analysis detailing your home's value as well as a comparison with similar homes in the area
Home Values in the Area
Average Home Value in this Area
Purchase History
| Date | Buyer | Sale Price | Title Company |
|---|---|---|---|
| Goodfellow Scott D | -- | -- | |
| Goodfellow Scott D | $184,000 | -- | |
| Koscielak Richard C | -- | -- |
Source: Public Records
Mortgage History
| Date | Status | Borrower | Loan Amount |
|---|---|---|---|
| Open | Goodfellow Scott D | $147,200 |
Source: Public Records
Tax History
| Year | Tax Paid | Tax Assessment Tax Assessment Total Assessment is a certain percentage of the fair market value that is determined by local assessors to be the total taxable value of land and additions on the property. | Land | Improvement |
|---|---|---|---|---|
| 2025 | $9,089 | $145,411 | $22,960 | $122,451 |
| 2024 | $8,833 | $145,411 | $22,960 | $122,451 |
| 2023 | $8,401 | $145,411 | $22,960 | $122,451 |
| 2022 | $6,983 | $107,608 | $15,215 | $92,393 |
| 2021 | $6,817 | $107,608 | $15,215 | $92,393 |
| 2020 | $6,896 | $107,608 | $15,215 | $92,393 |
| 2019 | $6,722 | $95,229 | $13,465 | $81,764 |
| 2018 | $6,296 | $95,229 | $13,465 | $81,764 |
| 2017 | $5,938 | $95,229 | $13,465 | $81,764 |
| 2016 | $5,489 | $85,985 | $13,472 | $72,513 |
| 2015 | $5,331 | $85,985 | $13,472 | $72,513 |
| 2014 | $5,335 | $85,985 | $13,472 | $72,513 |
| 2013 | $4,672 | $79,615 | $12,474 | $67,141 |
Source: Public Records
Map
Nearby Homes
- 2121 Clough Chase Dr
- 2105 Clough Chase Dr
- 7392 Hunley Rd
- 2559 Concordgreen Dr
- 7712 Stonehill Dr
- 7080 Hunley Rd
- 7481 Heatherwood Ln
- 1750 Emerald Glade Ln
- 1786 Woodpine Ln
- 2274 Pointe Place
- 1998 Lady Ellen Dr
- 1858 Foxhollow Dr
- 7122 Bluecrest Dr
- 1939 Lady Ellen Dr
- 1453 Verdale Dr
- 7053 Paddison Rd
- 2106 Forestlake Dr
- 7660 Clough Pike
- 7652 Clough Pike
- 7968 State Rd
- 2242 Bretton Dr
- 2226 Bretton Dr
- 2220 Bretton Dr
- 2235 Bretton Dr
- 2250 Bretton Dr
- 2250 Bretton Dr Unit 343
- 2228 Bretton Dr
- 2227 Bretton Dr
- 2243 Bretton Dr
- 2246 Bretton Dr
- 2251 Bretton Dr
- 2214 Bretton Dr
- 2256 Bretton Dr
- 2244 Donnington Ln
- 7365 Rudgate Ct
- 7371 Rudgate Ct
- 2259 Bretton Dr
- 2208 Bretton Dr
- 7359 Rudgate Ct
- 7377 Rudgate Ct
Your Personal Tour Guide
Ask me questions while you tour the home.