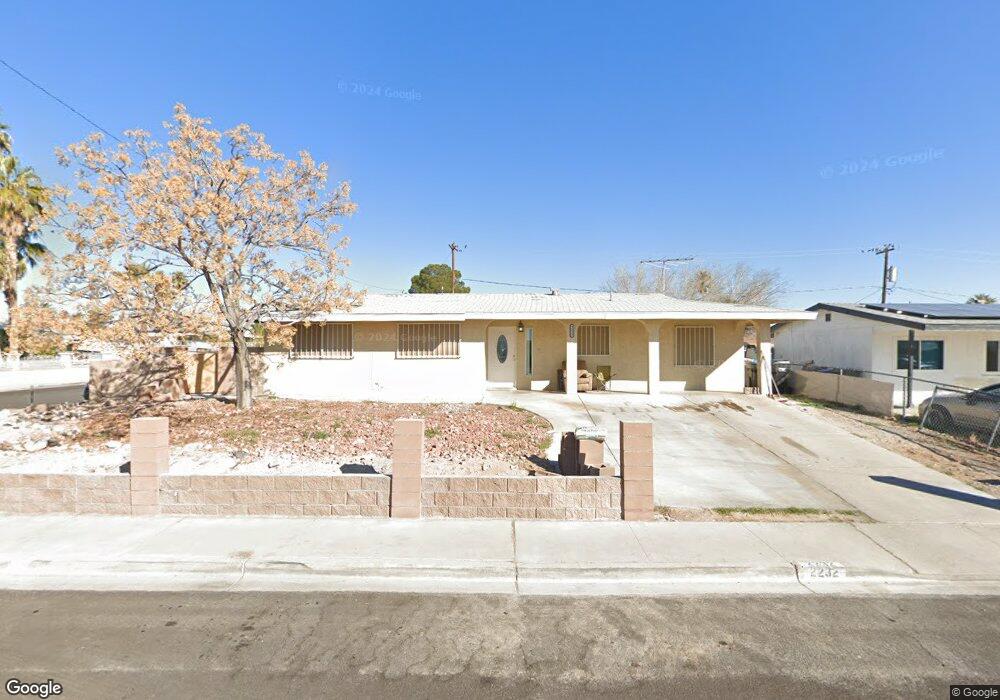
2232 Canary Way Las Vegas, NV 89106
West Las Vegas NeighborhoodEstimated Value: $305,181 - $330,000
3
Beds
2
Baths
1,086
Sq Ft
$293/Sq Ft
Est. Value
About This Home
This home is located at 2232 Canary Way, Las Vegas, NV 89106 and is currently estimated at $318,545, approximately $293 per square foot. 2232 Canary Way is a home located in Clark County with nearby schools including Wendell P. Williams Elementary School, West Prepatory Academy At Charlles I West Hall Sec, and Western High School.
Ownership History
Date
Name
Owned For
Owner Type
Purchase Details
Closed on
Apr 26, 2021
Sold by
Fuentes Janneth E and Delaluz Janneth E
Bought by
Fuentes Janneth E
Current Estimated Value
Purchase Details
Closed on
Sep 23, 2013
Sold by
Delaluz Alfredo
Bought by
Delaluz Janneth E
Purchase Details
Closed on
Feb 23, 2010
Sold by
Bank Of America Na
Bought by
Dela Luz Alfredo
Purchase Details
Closed on
Apr 8, 2009
Sold by
Rickman Carmela A
Bought by
Bank Of America Securities
Purchase Details
Closed on
Oct 5, 2006
Sold by
Rickman Carmela A
Bought by
Rickman Carmela A
Home Financials for this Owner
Home Financials are based on the most recent Mortgage that was taken out on this home.
Original Mortgage
$315,000
Interest Rate
6.55%
Mortgage Type
FHA
Purchase Details
Closed on
Aug 7, 2003
Sold by
Rickman Carmela A
Bought by
Rickman Carmela A and Carmela Antoinette Rickman 2003 Living T
Create a Home Valuation Report for This Property
The Home Valuation Report is an in-depth analysis detailing your home's value as well as a comparison with similar homes in the area
Home Values in the Area
Average Home Value in this Area
Purchase History
| Date | Buyer | Sale Price | Title Company |
|---|---|---|---|
| Fuentes Janneth E | -- | None Available | |
| Delaluz Janneth E | -- | None Available | |
| Dela Luz Alfredo | $47,000 | Fidelity Rainbow | |
| Bank Of America Na | $47,000 | Fidelity Rainbow | |
| Bank Of America Securities | $170,127 | Fidelity National Default So | |
| Rickman Carmela A | -- | Fidelity National Title | |
| Rickman Carmela A | -- | -- |
Source: Public Records
Mortgage History
| Date | Status | Borrower | Loan Amount |
|---|---|---|---|
| Previous Owner | Rickman Carmela A | $315,000 |
Source: Public Records
Tax History Compared to Growth
Tax History
| Year | Tax Paid | Tax Assessment Tax Assessment Total Assessment is a certain percentage of the fair market value that is determined by local assessors to be the total taxable value of land and additions on the property. | Land | Improvement |
|---|---|---|---|---|
| 2025 | $738 | $45,988 | $30,100 | $15,888 |
| 2024 | $633 | $45,988 | $30,100 | $15,888 |
| 2023 | $633 | $41,713 | $27,300 | $14,413 |
| 2022 | $587 | $35,594 | $22,750 | $12,844 |
| 2021 | $543 | $34,718 | $22,750 | $11,968 |
| 2020 | $502 | $31,197 | $19,600 | $11,597 |
| 2019 | $470 | $24,497 | $13,300 | $11,197 |
| 2018 | $449 | $22,792 | $12,250 | $10,542 |
| 2017 | $698 | $21,293 | $10,850 | $10,443 |
| 2016 | $421 | $16,387 | $6,300 | $10,087 |
| 2015 | $419 | $15,038 | $5,250 | $9,788 |
| 2014 | $406 | $13,063 | $3,500 | $9,563 |
Source: Public Records
Map
Nearby Homes
- 2520 Bottle Palm Ct
- 2400 Dutchmans Pipe Ct
- 2521 Rainbow Cactus Ct
- 1310 N Tonopah Dr
- 2624 Feather Cactus Ct
- 2625 Chin Cactus Ct
- 2133 Sleepy Ct
- 2632 Chin Cactus Ct
- 2211 Sleepy Ct
- 913 Jade Plant St
- 1604 Luning Dr
- 2045 Rose Coral Ave
- 1106 Arrowhead Ave
- 1103 Arrowhead Ave
- 814 W Bonanza Rd
- 1901 Manhattan Dr
- 2100 Port Ave
- 1204 Arrowhead Ave
- 2508 Ellingson Dr
- 1713 Ophir Dr
- 2228 Canary Way
- 2229 Dune Dr
- 2225 Dune Dr
- 2224 Canary Way Unit 6
- 1021 Nye St
- 1017 Nye St
- 2301 Dune Dr
- 2225 Canary Way
- 2229 Canary Way
- 2221 Dune Dr
- 2221 Canary Way
- 2220 Canary Way
- 1013 Nye St
- 2233 Canary Way Unit 6
- 2305 Dune Dr
- 2217 Dune Dr
- 2217 Canary Way
- 1020 Robin St
- 1016 Robin St
- 1016 Robin St Unit na