Estimated Value: $67,649 - $78,000
3
Beds
2
Baths
1,025
Sq Ft
$71/Sq Ft
Est. Value
About This Home
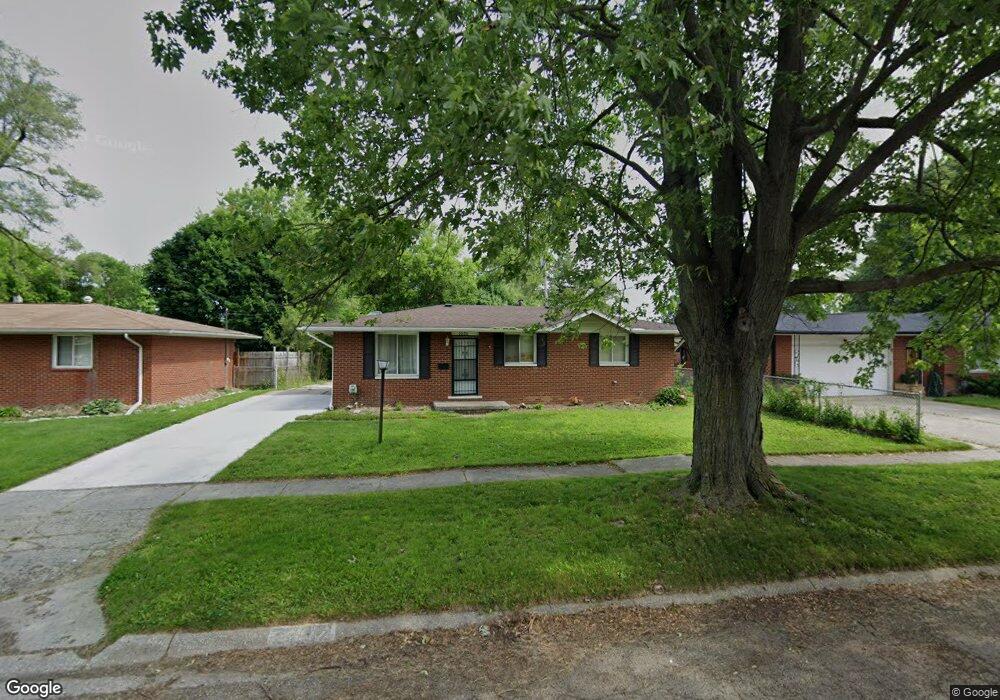
This home is located at 2232 Kevin David Dr, Flint, MI 48505 and is currently estimated at $72,412, approximately $70 per square foot. 2232 Kevin David Dr is a home located in Genesee County with nearby schools including Beecher High School, Northridge Academy, and The New Standard Academy.
Ownership History
Date
Name
Owned For
Owner Type
Purchase Details
Closed on
Jan 31, 2024
Sold by
Morris Robert
Bought by
Johnson Priscilla and Tucker Maurice
Current Estimated Value
Home Financials for this Owner
Home Financials are based on the most recent Mortgage that was taken out on this home.
Original Mortgage
$53,021
Outstanding Balance
$52,032
Interest Rate
6.61%
Mortgage Type
FHA
Estimated Equity
$20,380
Purchase Details
Closed on
Nov 26, 2008
Sold by
Smith Robert D and Smith Keana
Bought by
Security Federal Credit Union
Purchase Details
Closed on
Aug 22, 2006
Sold by
Smith Robert D and Smith Keana
Bought by
Cole Robbie
Purchase Details
Closed on
Nov 9, 2005
Sold by
Cole Eugene and Cole Robbie
Bought by
Security Fcu
Purchase Details
Closed on
May 9, 2005
Sold by
Smith Robert D
Bought by
Smith Robert D
Create a Home Valuation Report for This Property
The Home Valuation Report is an in-depth analysis detailing your home's value as well as a comparison with similar homes in the area
Home Values in the Area
Average Home Value in this Area
Purchase History
| Date | Buyer | Sale Price | Title Company |
|---|---|---|---|
| Johnson Priscilla | $54,000 | Bell Title | |
| Security Federal Credit Union | $55,242 | None Available | |
| Cole Robbie | -- | None Available | |
| Security Fcu | $43,574 | None Available | |
| Smith Robert D | -- | First American Title Ins Co |
Source: Public Records
Mortgage History
| Date | Status | Borrower | Loan Amount |
|---|---|---|---|
| Open | Johnson Priscilla | $53,021 |
Source: Public Records
Tax History
| Year | Tax Paid | Tax Assessment Tax Assessment Total Assessment is a certain percentage of the fair market value that is determined by local assessors to be the total taxable value of land and additions on the property. | Land | Improvement |
|---|---|---|---|---|
| 2025 | $993 | $37,700 | $0 | $0 |
| 2024 | $187 | $33,700 | $0 | $0 |
| 2023 | $179 | $31,600 | $0 | $0 |
| 2022 | $1,143 | $23,400 | $0 | $0 |
| 2021 | $1,138 | $22,100 | $0 | $0 |
| 2020 | $163 | $17,300 | $0 | $0 |
| 2019 | $161 | $14,400 | $0 | $0 |
| 2018 | $1,055 | $15,900 | $0 | $0 |
| 2017 | $1,024 | $14,300 | $0 | $0 |
| 2016 | $1,017 | $14,900 | $0 | $0 |
| 2015 | $875 | $13,100 | $0 | $0 |
| 2014 | $175 | $15,200 | $0 | $0 |
| 2012 | -- | $17,000 | $17,000 | $0 |
Source: Public Records
Map
Nearby Homes
- 5447 Mendel Berger Dr
- 2262 Toby Beth Dr
- 5444 Mendel Berger Dr
- 2273 Toby Beth Dr
- 2236 Rosenfield Dr
- 2303 W Coldwater Rd
- 6054 Ballard Dr
- 5454 Kellar Ave
- 2044 W Princeton Ave
- 6104 Hilton Ln
- 2008 Daron Place
- 6121 Otoole Ln
- 6162 Hilton Ln
- 5471 Fairhaven St
- 1443 Charwood Rd
- 6069 Natchez Dr
- 5485 Detroit St
- 5401 Detroit St
- 0 Detroit St Unit 25061886
- 0 Detroit St Unit 25061882
- 2231 Douglas Joel Dr
- 2238 Kevin David Dr
- 2224 Kevin David Dr
- 5481 Mendel Berger Dr
- 5487 Mendel Berger Dr
- 2244 Kevin David Dr
- 2237 Douglas Joel Dr
- 2243 Douglas Joel Dr
- 2225 Kevin David Dr
- 2233 Kevin David Dr
- 2250 Kevin David Dr
- 2239 Kevin David Dr
- 2249 Douglas Joel Dr
- 2245 Kevin David Dr
- 5453 Mendel Berger Dr
- 2256 Kevin David Dr
- 5474 Mendel Berger Dr
- 5468 Mendel Berger Dr
- 5480 Mendel Berger Dr
- 2251 Kevin David Dr
Your Personal Tour Guide
Ask me questions while you tour the home.