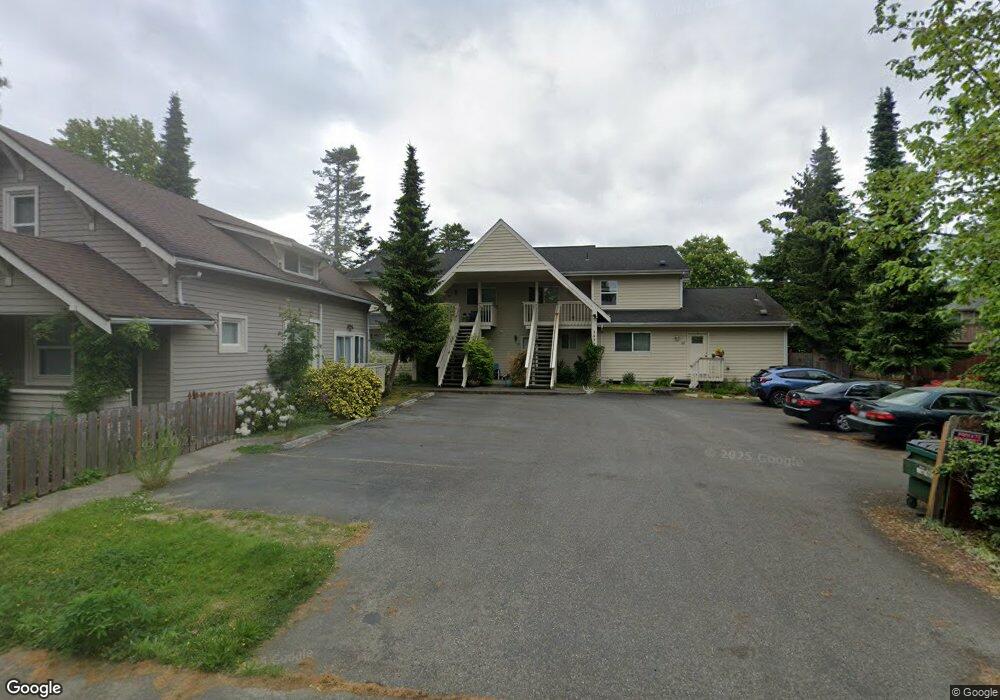
2232 Verona St Unit 3 Bellingham, WA 98229
Roosevelt NeighborhoodEstimated Value: $330,427 - $353,000
2
Beds
1
Bath
974
Sq Ft
$352/Sq Ft
Est. Value
About This Home
This home is located at 2232 Verona St Unit 3, Bellingham, WA 98229 and is currently estimated at $343,107, approximately $352 per square foot. 2232 Verona St Unit 3 is a home located in Whatcom County with nearby schools including Roosevelt Elementary School, Kulshan Middle School, and Bellingham High School.
Ownership History
Date
Name
Owned For
Owner Type
Purchase Details
Closed on
Nov 22, 2019
Sold by
Morales Raquel
Bought by
Binderup Emma
Current Estimated Value
Home Financials for this Owner
Home Financials are based on the most recent Mortgage that was taken out on this home.
Original Mortgage
$203,150
Outstanding Balance
$179,250
Interest Rate
3.75%
Mortgage Type
New Conventional
Estimated Equity
$163,857
Purchase Details
Closed on
Sep 21, 2016
Sold by
Jonasson Kami M and Jonasson Aaron
Bought by
Morales Raquel
Purchase Details
Closed on
Feb 26, 2013
Sold by
Lewis Louise G and Legarde Louise G
Bought by
Botteron Kami M
Home Financials for this Owner
Home Financials are based on the most recent Mortgage that was taken out on this home.
Original Mortgage
$105,061
Interest Rate
3.34%
Mortgage Type
FHA
Create a Home Valuation Report for This Property
The Home Valuation Report is an in-depth analysis detailing your home's value as well as a comparison with similar homes in the area
Home Values in the Area
Average Home Value in this Area
Purchase History
| Date | Buyer | Sale Price | Title Company |
|---|---|---|---|
| Binderup Emma | $239,000 | Whatcom Land Title | |
| Morales Raquel | $125,000 | First American Title | |
| Botteron Kami M | $107,280 | First American Title Ins |
Source: Public Records
Mortgage History
| Date | Status | Borrower | Loan Amount |
|---|---|---|---|
| Open | Binderup Emma | $203,150 | |
| Previous Owner | Botteron Kami M | $105,061 |
Source: Public Records
Tax History Compared to Growth
Tax History
| Year | Tax Paid | Tax Assessment Tax Assessment Total Assessment is a certain percentage of the fair market value that is determined by local assessors to be the total taxable value of land and additions on the property. | Land | Improvement |
|---|---|---|---|---|
| 2024 | $2,456 | $315,840 | $52,640 | $263,200 |
| 2023 | $2,456 | $315,840 | $52,640 | $263,200 |
| 2022 | $2,146 | $261,030 | $43,505 | $217,525 |
| 2021 | $2,067 | $231,000 | $38,500 | $192,500 |
| 2020 | $1,507 | $210,000 | $35,000 | $175,000 |
| 2019 | $1,239 | $148,008 | $23,898 | $124,110 |
| 2018 | $1,310 | $121,996 | $19,698 | $102,298 |
| 2017 | $1,158 | $110,245 | $17,801 | $92,444 |
| 2016 | $1,051 | $101,884 | $16,451 | $85,433 |
| 2015 | $1,048 | $96,310 | $15,551 | $80,759 |
| 2014 | -- | $92,900 | $15,000 | $77,900 |
| 2013 | -- | $95,058 | $13,748 | $81,310 |
Source: Public Records
Map
Nearby Homes
- 2325 Valencia St
- 2327 Valencia St Unit 102
- 2327 Valencia St Unit 101
- 2330 Verona St
- 2316 Xenia St
- 950 Yew St
- 2617 Woburn St
- 2619 Woburn St
- 2639 Yew St
- 2200 Ontario St
- 1737 Sunup Loop
- 1735 Sunup Loop
- 1733 Sunup Loop
- 3020 E North St
- 3024 E North St
- 2809 Valencia St
- 2218 Niagara Dr
- 1515 Woburn St
- 1714 Sunup Loop
- 1716 Sunup Loop
- 2232 Verona St Unit 103
- 2232 Verona St Unit 5
- 2232 Verona St Unit 201
- 2232 Verona St Unit 2
- 2232 Verona St Unit 101
- 2232 Verona St
- 2232 Verona St Unit 102
- 2236 Verona St Unit 203
- 2245 Valencia St
- 2228 Verona St
- 2244 Verona St
- 2231 Valencia St
- 2231 Valencia St Unit 1-4
- 2237 Valencia St
- 2243 Valencia St
- 2227 Valencia St
- 2312 Verona St
- 2312 Verona St Unit 9
- 2312 Verona St Unit 8
- 2312 Verona St Unit 7