Estimated Value: $62,000 - $100,000
3
Beds
1
Bath
1,095
Sq Ft
$79/Sq Ft
Est. Value
About This Home
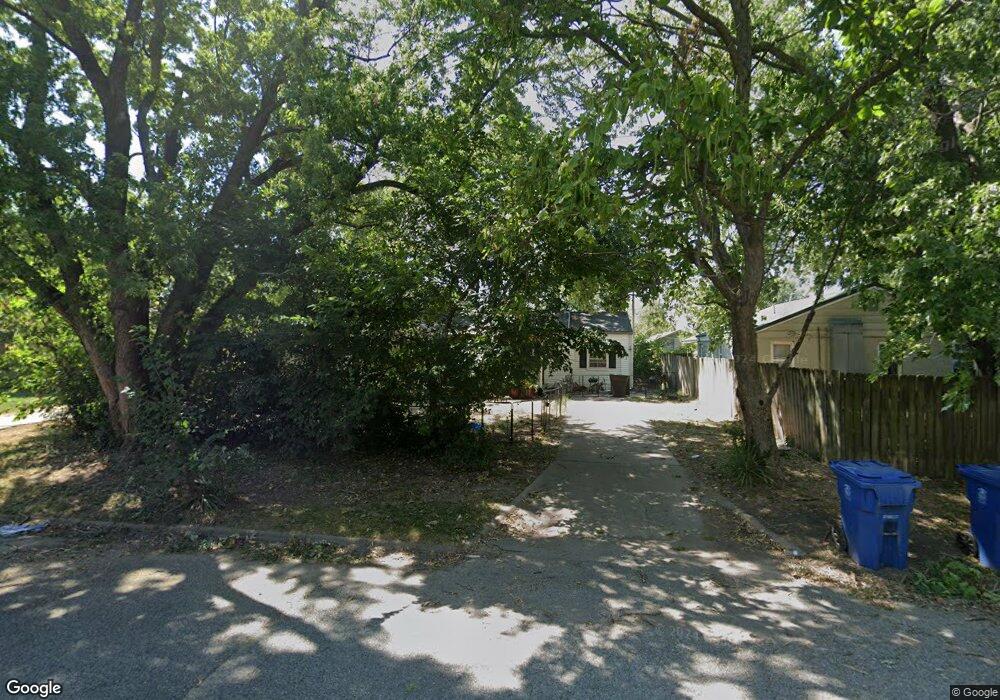
This home is located at 2233 C St NE, Miami, OK 74354 and is currently estimated at $86,950, approximately $79 per square foot. 2233 C St NE is a home located in Ottawa County with nearby schools including Miami High School and Mt. Olive Lutheran School.
Ownership History
Date
Name
Owned For
Owner Type
Purchase Details
Closed on
Jul 8, 2013
Sold by
Widby Nathan T and Widby Rachel A
Bought by
Quaker Valley Properties Llc
Current Estimated Value
Home Financials for this Owner
Home Financials are based on the most recent Mortgage that was taken out on this home.
Original Mortgage
$43,400
Interest Rate
3.63%
Mortgage Type
Future Advance Clause Open End Mortgage
Purchase Details
Closed on
Oct 24, 2005
Sold by
Brown Toni Lee
Bought by
Widby Nathan T and Widby Rachel
Home Financials for this Owner
Home Financials are based on the most recent Mortgage that was taken out on this home.
Original Mortgage
$45,000
Interest Rate
5.75%
Mortgage Type
New Conventional
Create a Home Valuation Report for This Property
The Home Valuation Report is an in-depth analysis detailing your home's value as well as a comparison with similar homes in the area
Home Values in the Area
Average Home Value in this Area
Purchase History
| Date | Buyer | Sale Price | Title Company |
|---|---|---|---|
| Quaker Valley Properties Llc | $43,500 | Ottawa County Abstract & Tit | |
| Widby Nathan T | $40,000 | None Available |
Source: Public Records
Mortgage History
| Date | Status | Borrower | Loan Amount |
|---|---|---|---|
| Closed | Quaker Valley Properties Llc | $43,400 | |
| Previous Owner | Widby Nathan T | $45,000 |
Source: Public Records
Tax History Compared to Growth
Tax History
| Year | Tax Paid | Tax Assessment Tax Assessment Total Assessment is a certain percentage of the fair market value that is determined by local assessors to be the total taxable value of land and additions on the property. | Land | Improvement |
|---|---|---|---|---|
| 2025 | $451 | $4,281 | $342 | $3,939 |
| 2024 | $451 | $4,680 | $342 | $4,338 |
| 2023 | $451 | $4,457 | $342 | $4,115 |
| 2022 | $412 | $4,457 | $342 | $4,115 |
| 2021 | $403 | $4,267 | $342 | $3,925 |
| 2020 | $387 | $4,064 | $342 | $3,722 |
| 2019 | $331 | $4,028 | $342 | $3,686 |
| 2018 | $333 | $4,028 | $342 | $3,686 |
| 2017 | $338 | $4,028 | $342 | $3,686 |
| 2016 | $333 | $4,145 | $342 | $3,803 |
| 2015 | $405 | $4,560 | $432 | $4,128 |
| 2014 | $377 | $4,608 | $342 | $4,266 |
Source: Public Records
Map
Nearby Homes
- 2220 B St NE
- 1916 A St NE
- 1839 D St NE
- 1821 C St NE
- 1644 D St NE
- 2101 Birnamwood Dr
- 1934 Birnamwood Dr
- 1902 G St NW
- 1300 Maple Dr
- 1525 N Main St
- 2405 Molly Ln
- 1408 Morgan Cir
- 1311 Park Heights St
- 1209 B St NW
- 1611 Woodlawn Dr
- 416 Admiral Trussler Blvd
- 2425 Birch Ct
- 108 Oak Ln
- 706 Coyne St
- 411 E Bj Tunnell Blvd