
Seller's Agent in 2025
Manish Arora
Samson Properties
(202) 549-0229
3 in this area
48 Total Sales
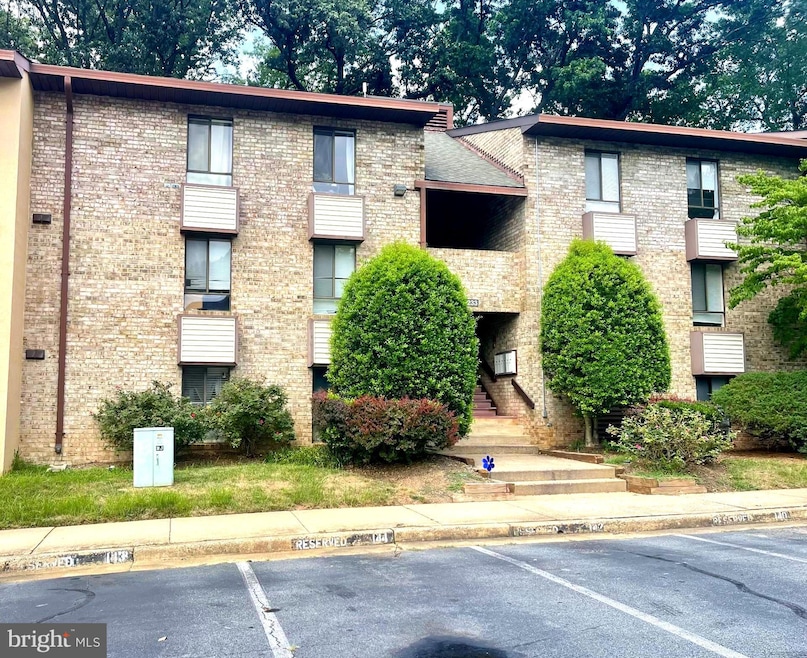
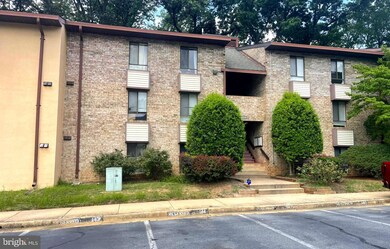
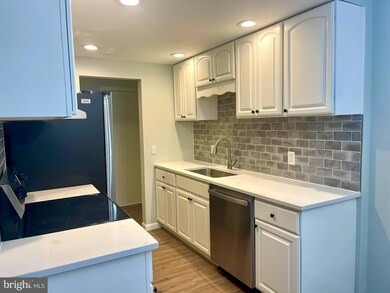

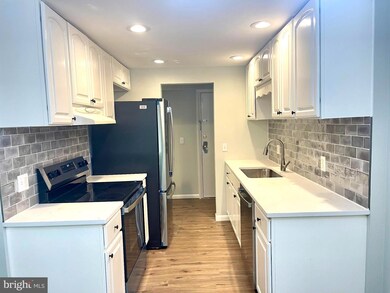
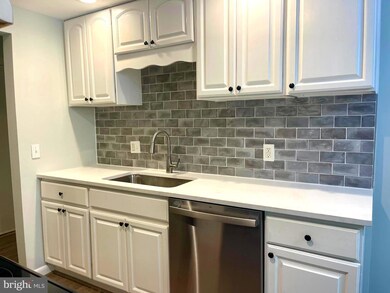
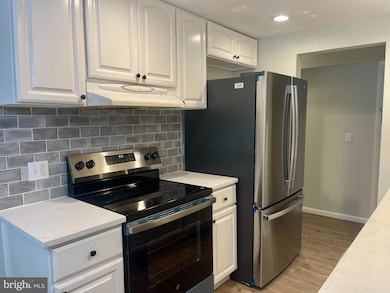
Welcome to your next home nestled in the sought-after Shadowood Condominiums of Reston. This stylish 2 bedroom, 2 bathroom condo ( 894 sq ft) blends comfort, convenience, and community. Spacious layout with separate living and dining areas — ideal for relaxing or entertaining. Open kitchen featuring 42′′ cabinetry, Recent upgrades include, new quartz countertops, new SS appliances, new LVP flooring throughout, updated light fixtures, new paint. In-unit laundry with stacked washer/dryer for your convenience. Walk-out patio, perfect for morning coffee or evening wind-down. All utilities included in condo fees – gas, electric, water/sewer, A/C, trash, and parking, Walk or bike to nearby Silver Line Metro, with fast access to Dulles Toll Road, Fairfax County Parkway & Reston Town Center, Community amenities include a refreshing outdoor pool, tennis & basketball courts, clubhouse, and miles of picturesque walking paths
Last Agent to Sell the Property
(202) 549-0229 marora1973@hotmail.com Samson Properties Listed on: 07/29/2025
| Date | Type | Sale Price | Title Company |
|---|---|---|---|
| Deed | $285,000 | Old Republic National Title In | |
| Warranty Deed | $240,000 | -- | |
| Deed | $133,000 | -- |
| Date | Status | Loan Amount | Loan Type |
|---|---|---|---|
| Open | $285,000 | VA | |
| Previous Owner | $192,000 | New Conventional | |
| Previous Owner | $129,010 | New Conventional |
| Date | Event | Price | List to Sale | Price per Sq Ft |
|---|---|---|---|---|
| 10/03/2025 10/03/25 | Sold | $285,000 | 0.0% | $319 / Sq Ft |
| 07/29/2025 07/29/25 | For Sale | $285,000 | 0.0% | $319 / Sq Ft |
| 11/23/2022 11/23/22 | Rented | $1,850 | 0.0% | -- |
| 10/26/2022 10/26/22 | Price Changed | $1,850 | -5.1% | $2 / Sq Ft |
| 10/15/2022 10/15/22 | For Rent | $1,950 | +20.0% | -- |
| 03/21/2020 03/21/20 | Rented | $1,625 | 0.0% | -- |
| 03/10/2020 03/10/20 | For Rent | $1,625 | +6.6% | -- |
| 12/15/2017 12/15/17 | Rented | $1,525 | 0.0% | -- |
| 12/13/2017 12/13/17 | Under Contract | -- | -- | -- |
| 12/05/2017 12/05/17 | For Rent | $1,525 | -- | -- |
| Year | Tax Paid | Tax Assessment Tax Assessment Total Assessment is a certain percentage of the fair market value that is determined by local assessors to be the total taxable value of land and additions on the property. | Land | Improvement |
|---|---|---|---|---|
| 2025 | $2,763 | $247,580 | $50,000 | $197,580 |
| 2024 | $2,763 | $229,240 | $46,000 | $183,240 |
| 2023 | $2,566 | $218,320 | $44,000 | $174,320 |
| 2022 | $2,355 | $205,960 | $41,000 | $164,960 |
| 2021 | $2,394 | $196,150 | $39,000 | $157,150 |
| 2020 | $2,277 | $185,050 | $37,000 | $148,050 |
| 2019 | $1,101 | $178,970 | $33,000 | $145,970 |
| 2018 | $1,923 | $167,260 | $33,000 | $134,260 |
| 2017 | $1,851 | $153,260 | $31,000 | $122,260 |
| 2016 | $1,890 | $156,780 | $31,000 | $125,780 |
| 2015 | $1,861 | $159,980 | $32,000 | $127,980 |
| 2014 | $1,736 | $149,610 | $30,000 | $119,610 |
Seller's Agent in 2025
Manish Arora
Samson Properties
(202) 549-0229
3 in this area
48 Total Sales
Buyer's Agent in 2025
Kunlavee Dangcham
EXP Realty, LLC
(202) 304-5667
1 in this area
34 Total Sales
Buyer's Agent in 2022
Brett Korade
Keller Williams Realty
(703) 321-6994
1 in this area
107 Total Sales
Seller's Agent in 2020
Hardeep Saini
Regal Realty Group, Inc.
(703) 624-0309
1 in this area
20 Total Sales
M
Buyer's Agent in 2020
Mir Ali
Fairfax Realty of Tysons
(703) 314-4216
1 Total Sale
S
Seller's Agent in 2017
Suzanne Petrie
RE/MAX
Source: Bright MLS
MLS Number: VAFX2258826
APN: 0262-07330002B
Disclaimer: Certain information contained herein is derived from information provided by parties other than Homes.com. All information provided is deemed reliable, but is not guaranteed to be accurate and should be independently verified.
![]() The data relating to real estate for sale on this website appears in part through the BRIGHT Internet Data Exchange program, a voluntary cooperative exchange of property listing data between licensed real estate brokerage firms, and is provided by BRIGHT through a licensing agreement.
The data relating to real estate for sale on this website appears in part through the BRIGHT Internet Data Exchange program, a voluntary cooperative exchange of property listing data between licensed real estate brokerage firms, and is provided by BRIGHT through a licensing agreement.
Listing information is from various brokers who participate in the Bright MLS IDX program and not all listings may be visible on the site.
The property information being provided on or through the website is for the personal, non-commercial use of consumers and such information may not be used for any purpose other than to identify prospective properties consumers may be interested in purchasing.
Some properties which appear for sale on the website may no longer be available because they are for instance, under contract, sold or are no longer being offered for sale.
Property information displayed is deemed reliable but is not guaranteed.
Copyright 2025 Bright MLS, Inc.