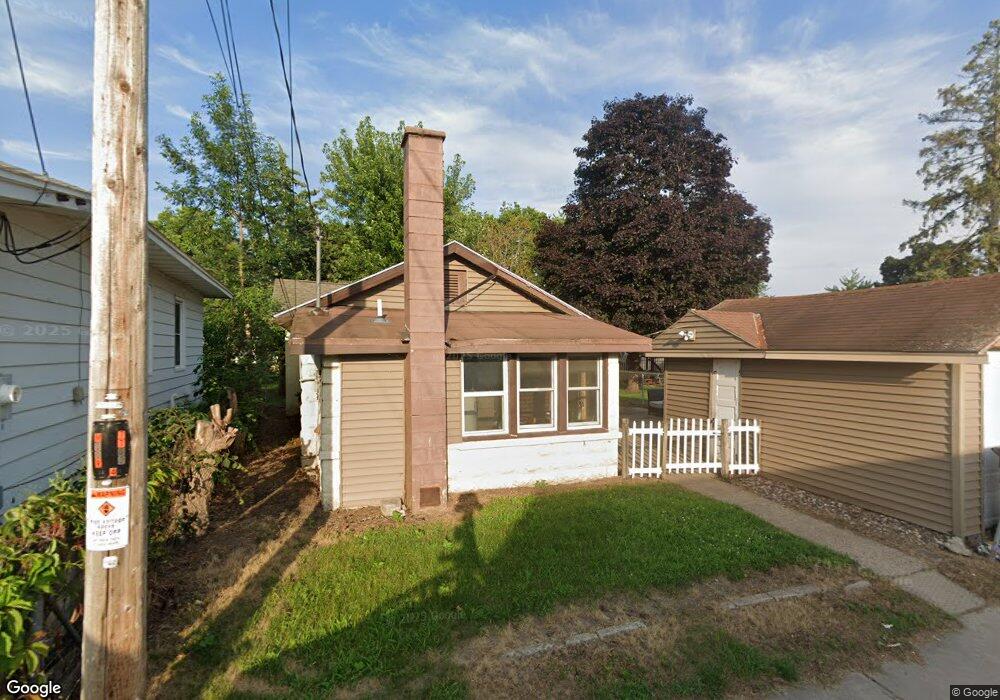
2233 Kane St La Crosse, WI 54603
Logan Northside NeighborhoodEstimated Value: $122,523 - $153,000
2
Beds
1
Bath
712
Sq Ft
$188/Sq Ft
Est. Value
About This Home
This home is located at 2233 Kane St, La Crosse, WI 54603 and is currently estimated at $134,131, approximately $188 per square foot. 2233 Kane St is a home located in La Crosse County with nearby schools including Northside Elementary School, Logan Middle School, and Logan High School.
Ownership History
Date
Name
Owned For
Owner Type
Purchase Details
Closed on
May 26, 2016
Sold by
Jackson Robert A
Bought by
Jarvis Randy D and Jarvis Sara J
Current Estimated Value
Home Financials for this Owner
Home Financials are based on the most recent Mortgage that was taken out on this home.
Original Mortgage
$34,700
Outstanding Balance
$27,680
Interest Rate
3.64%
Estimated Equity
$106,451
Purchase Details
Closed on
Apr 26, 2011
Sold by
Park Bank
Bought by
Federal National Mortgage Association
Purchase Details
Closed on
Apr 25, 2011
Sold by
Federal National Mortgage Association
Bought by
Jackson Robert
Purchase Details
Closed on
Jan 21, 2011
Sold by
Grass Andrew J and Grass Sherie L
Bought by
Park Bank
Create a Home Valuation Report for This Property
The Home Valuation Report is an in-depth analysis detailing your home's value as well as a comparison with similar homes in the area
Home Values in the Area
Average Home Value in this Area
Purchase History
| Date | Buyer | Sale Price | Title Company |
|---|---|---|---|
| Jarvis Randy D | -- | -- | |
| Federal National Mortgage Association | -- | None Available | |
| Jackson Robert | -- | None Available | |
| Park Bank | $145,869 | None Available |
Source: Public Records
Mortgage History
| Date | Status | Borrower | Loan Amount |
|---|---|---|---|
| Open | Jarvis Randy D | $34,700 | |
| Closed | Jarvis Randy D | -- |
Source: Public Records
Tax History Compared to Growth
Tax History
| Year | Tax Paid | Tax Assessment Tax Assessment Total Assessment is a certain percentage of the fair market value that is determined by local assessors to be the total taxable value of land and additions on the property. | Land | Improvement |
|---|---|---|---|---|
| 2023 | $1,456 | $74,000 | $16,500 | $57,500 |
| 2022 | $1,384 | $74,000 | $16,500 | $57,500 |
| 2021 | $1,317 | $53,400 | $16,500 | $36,900 |
| 2020 | $1,297 | $53,400 | $16,500 | $36,900 |
| 2019 | $1,291 | $53,400 | $16,500 | $36,900 |
| 2018 | $1,283 | $46,700 | $15,300 | $31,400 |
| 2017 | $1,282 | $46,700 | $15,300 | $31,400 |
| 2016 | $1,318 | $45,300 | $15,300 | $30,000 |
| 2015 | $1,239 | $45,300 | $15,300 | $30,000 |
| 2014 | $1,534 | $45,300 | $15,300 | $30,000 |
| 2013 | $1,593 | $45,300 | $15,300 | $30,000 |
Source: Public Records
Map
Nearby Homes
- 2302 Wood St
- 701 George St
- 1912 Liberty St
- 1826 Avon St
- 1822 Avon St
- 1820 Wood St
- 2006 Prospect St
- 1918 Prospect St
- 1621 Livingston St
- 1633 Liberty St
- 910 Logan St
- 1336 Kane St
- 2809 Larson St
- 1352 Nakomis Ave
- 2713 Hemstock St
- 0 Tellin Ct Unit 1617248
- 0 Tellin Ct Unit 1617246
- 0 Tellin Ct Unit 1617243
- 0 Tellin Ct Unit 1617241
- 0 Tellin Ct Unit 1617240