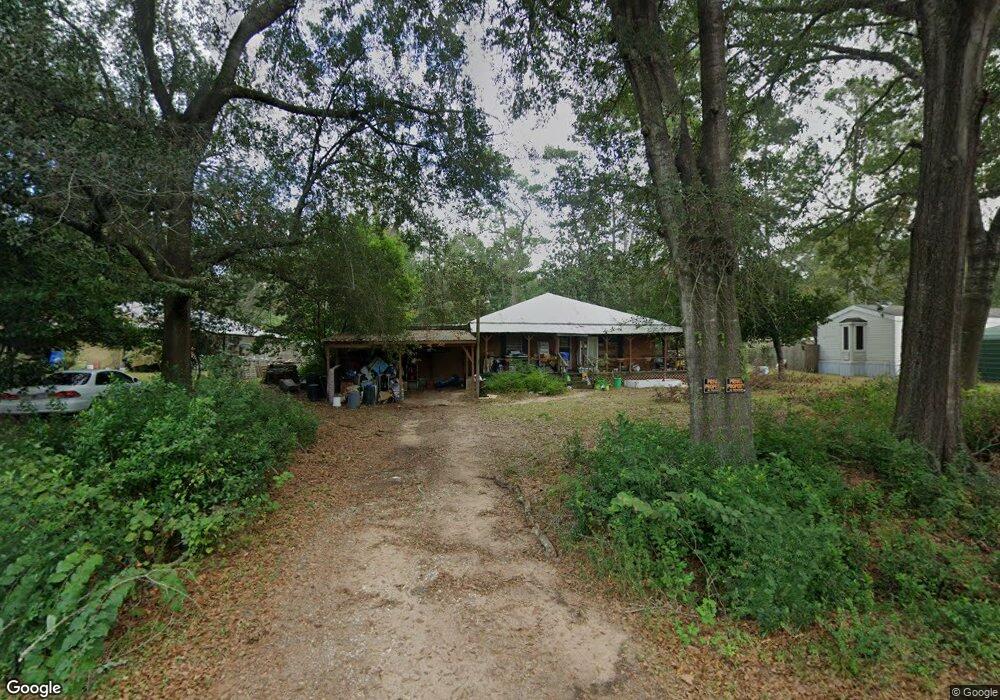
22330 Main Blvd Tomball, TX 77377
Estimated Value: $341,907 - $403,000
4
Beds
3
Baths
2,375
Sq Ft
$152/Sq Ft
Est. Value
About This Home
This home is located at 22330 Main Blvd, Tomball, TX 77377 and is currently estimated at $360,727, approximately $151 per square foot. 22330 Main Blvd is a home located in Harris County with nearby schools including Rosehill Elementary School, Tomball Intermediate School, and Tomball Junior High School.
Ownership History
Date
Name
Owned For
Owner Type
Purchase Details
Closed on
Jun 7, 2006
Sold by
Slawson Jess E and Slawson Donna M
Bought by
Going Ronald F
Current Estimated Value
Home Financials for this Owner
Home Financials are based on the most recent Mortgage that was taken out on this home.
Original Mortgage
$104,000
Outstanding Balance
$58,780
Interest Rate
6.56%
Mortgage Type
Fannie Mae Freddie Mac
Estimated Equity
$301,947
Purchase Details
Closed on
Dec 10, 2001
Sold by
Staples James L and Staples Judy
Bought by
Slawson Jess E and Slawson Donna M
Home Financials for this Owner
Home Financials are based on the most recent Mortgage that was taken out on this home.
Original Mortgage
$98,500
Interest Rate
10.5%
Create a Home Valuation Report for This Property
The Home Valuation Report is an in-depth analysis detailing your home's value as well as a comparison with similar homes in the area
Purchase History
| Date | Buyer | Sale Price | Title Company |
|---|---|---|---|
| Going Ronald F | -- | Stewart Title Houston Div | |
| Slawson Jess E | -- | Alamo Title Company |
Source: Public Records
Mortgage History
| Date | Status | Borrower | Loan Amount |
|---|---|---|---|
| Open | Going Ronald F | $104,000 | |
| Previous Owner | Slawson Jess E | $98,500 |
Source: Public Records
Tax History
| Year | Tax Paid | Tax Assessment Tax Assessment Total Assessment is a certain percentage of the fair market value that is determined by local assessors to be the total taxable value of land and additions on the property. | Land | Improvement |
|---|---|---|---|---|
| 2025 | $416 | $324,917 | $44,263 | $280,654 |
| 2024 | $416 | $324,917 | $44,263 | $280,654 |
| 2023 | $416 | $324,917 | $44,263 | $280,654 |
| 2022 | $3,740 | $275,773 | $44,263 | $231,510 |
| 2021 | $3,514 | $164,007 | $19,673 | $144,334 |
| 2020 | $3,951 | $178,429 | $19,673 | $158,756 |
| 2019 | $3,895 | $178,429 | $19,673 | $158,756 |
| 2018 | $494 | $155,096 | $11,804 | $143,292 |
| 2017 | $3,367 | $155,096 | $11,804 | $143,292 |
| 2016 | $3,061 | $155,096 | $11,804 | $143,292 |
| 2015 | $765 | $155,096 | $11,804 | $143,292 |
| 2014 | $765 | $161,169 | $11,804 | $149,365 |
Source: Public Records
Map
Nearby Homes
- 22420 Meadowhurst Cir W
- 19332 Chateau Ridge Ct
- 19315 Whispering Grove E
- 22114 E Meadowhurst Cir
- 22827 Edward Ln
- 19603 Fm 2920 Rd
- 21843 Rose Maris Ln
- 19242 Red Cascade Ct
- 22111 Loblolly Dr
- 22111 Loblolly Rd
- 27481 Serene Pine
- 27438 Serene Pine Ln
- 27418 Serene Pine Ln
- 27469 Serene Pine Dr
- 22022 Loblolly Dr
- 27418 Serene Pine Dr
- 16446 Misty Cedar Ln
- 22742 Timberlake Creek Rd
- 21719 Mueschke Rd
- 26164 Grand Pines Rd
- 22326 Main Blvd
- 22330 Main Bl
- 22318 Main Blvd
- 22203 Roseway Rd
- 22406 Main Blvd
- 22314 Main Blvd
- LOT 26 Roseway Rd
- 22410 Main Blvd
- 22131 Roseway Rd
- 22407 Main Blvd
- 22415 Main Blvd
- 22239 Main Blvd
- 22311 Main Blvd
- 22306 Main Blvd
- 19414 Whispering Gr
- 19415 Whispering Gr
- 19415 W Whispering Grove
- 22307 Main Blvd
- 22419 Main Blvd
- 22237 Main Blvd
Your Personal Tour Guide
Ask me questions while you tour the home.