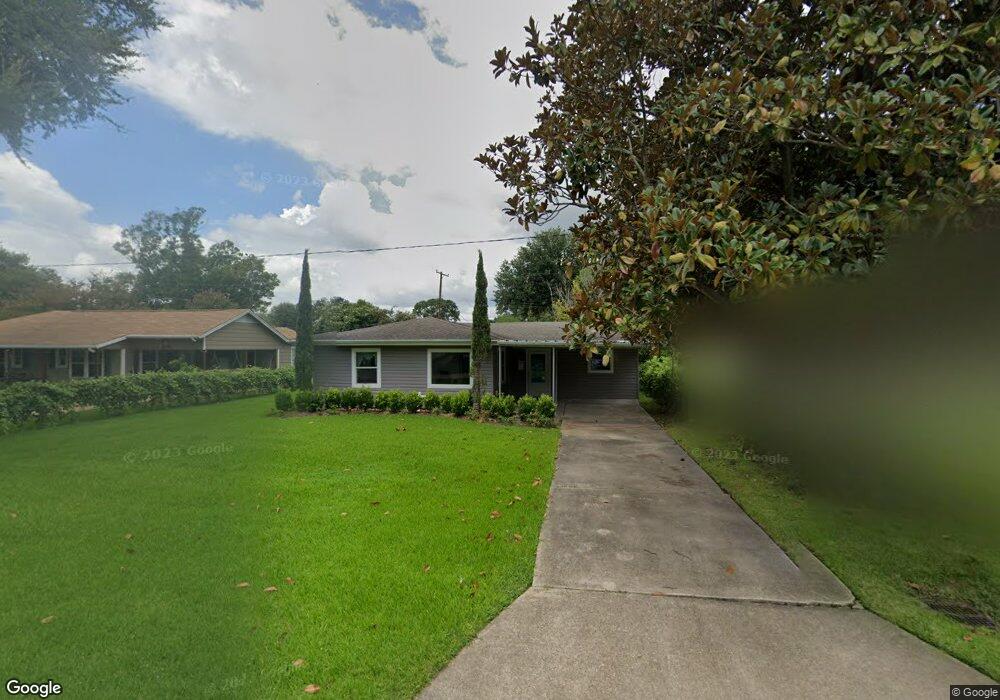
2234 5th St Unit $1500 BTSA Port Neches, TX 77651
Estimated Value: $155,000 - $218,000
--
Bed
1
Bath
1,177
Sq Ft
$148/Sq Ft
Est. Value
About This Home
This home is located at 2234 5th St Unit $1500 BTSA, Port Neches, TX 77651 and is currently estimated at $174,001, approximately $147 per square foot. 2234 5th St Unit $1500 BTSA is a home located in Jefferson County.
Ownership History
Date
Name
Owned For
Owner Type
Purchase Details
Closed on
Feb 28, 2024
Sold by
H-Mac Investment Group Llc
Bought by
Lee Joshuah Ryan
Current Estimated Value
Home Financials for this Owner
Home Financials are based on the most recent Mortgage that was taken out on this home.
Original Mortgage
$143,100
Outstanding Balance
$140,706
Interest Rate
6.6%
Mortgage Type
New Conventional
Estimated Equity
$33,295
Purchase Details
Closed on
Aug 18, 2016
Sold by
Stark Travis A and Stark Bernis
Bought by
Ardoin Lyndal
Create a Home Valuation Report for This Property
The Home Valuation Report is an in-depth analysis detailing your home's value as well as a comparison with similar homes in the area
Home Values in the Area
Average Home Value in this Area
Purchase History
| Date | Buyer | Sale Price | Title Company |
|---|---|---|---|
| Lee Joshuah Ryan | -- | Texas Regional Title | |
| Ardoin Lyndal | -- | None Available |
Source: Public Records
Mortgage History
| Date | Status | Borrower | Loan Amount |
|---|---|---|---|
| Open | Lee Joshuah Ryan | $143,100 |
Source: Public Records
Tax History Compared to Growth
Tax History
| Year | Tax Paid | Tax Assessment Tax Assessment Total Assessment is a certain percentage of the fair market value that is determined by local assessors to be the total taxable value of land and additions on the property. | Land | Improvement |
|---|---|---|---|---|
| 2025 | $3,911 | $159,148 | $29,894 | $129,254 |
| 2024 | $3,911 | $150,629 | $18,144 | $132,485 |
| 2023 | $3,911 | $116,436 | $0 | $0 |
| 2022 | $2,834 | $105,851 | $0 | $0 |
| 2021 | $2,721 | $103,862 | $18,144 | $85,718 |
| 2020 | $508 | $87,480 | $18,144 | $69,336 |
| 2019 | $2,300 | $79,980 | $18,140 | $61,840 |
| 2018 | $380 | $74,360 | $18,140 | $56,220 |
| 2017 | $353 | $72,490 | $18,140 | $54,350 |
| 2016 | $1,902 | $68,740 | $18,140 | $50,600 |
| 2015 | $306 | $68,740 | $18,140 | $50,600 |
| 2014 | $306 | $68,740 | $18,140 | $50,600 |
Source: Public Records
Map
Nearby Homes