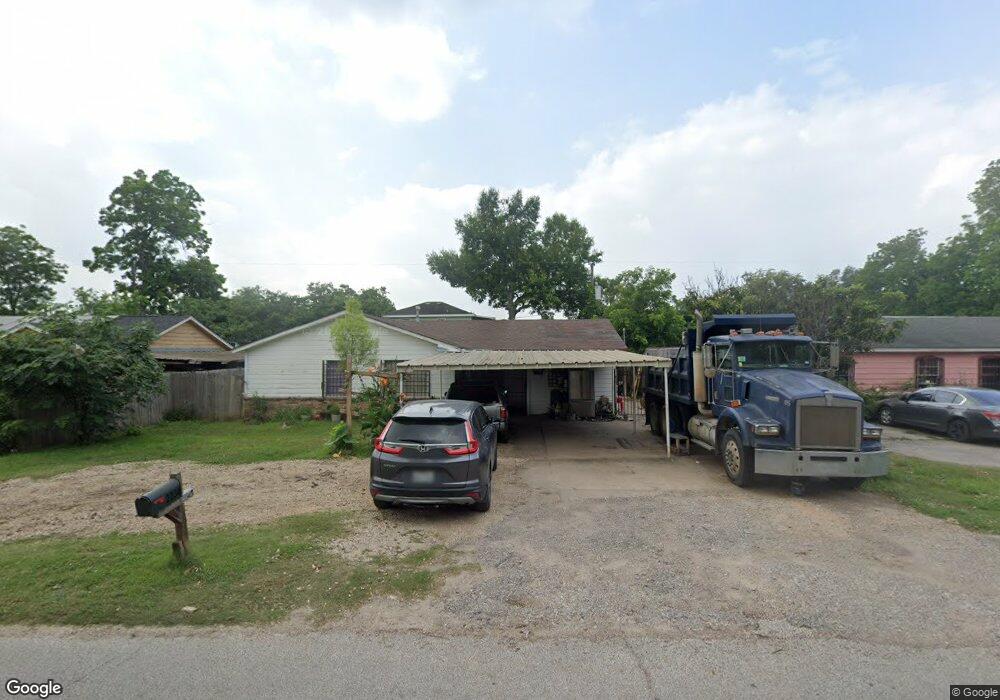
2234 Brea Crest St Houston, TX 77093
East Aldine NeighborhoodEstimated Value: $174,000 - $190,000
3
Beds
1
Bath
1,189
Sq Ft
$151/Sq Ft
Est. Value
About This Home
This home is located at 2234 Brea Crest St, Houston, TX 77093 and is currently estimated at $180,131, approximately $151 per square foot. 2234 Brea Crest St is a home located in Harris County with nearby schools including Vardeman EC/PK/K, Worsham Elementary School, and Macarthur Ninth Grade School.
Ownership History
Date
Name
Owned For
Owner Type
Purchase Details
Closed on
Nov 11, 2022
Sold by
Mayoral Jose
Bought by
Mayoral Javier Landin and Mayoral Maria L
Current Estimated Value
Purchase Details
Closed on
Jun 28, 2002
Sold by
Boothe Carl
Bought by
Aguila Jose Mayoral
Home Financials for this Owner
Home Financials are based on the most recent Mortgage that was taken out on this home.
Original Mortgage
$62,777
Interest Rate
6.89%
Mortgage Type
FHA
Purchase Details
Closed on
Jun 24, 2002
Sold by
Williams Hazel Rae
Bought by
Boothe Carl
Home Financials for this Owner
Home Financials are based on the most recent Mortgage that was taken out on this home.
Original Mortgage
$62,777
Interest Rate
6.89%
Mortgage Type
FHA
Purchase Details
Closed on
Dec 3, 1997
Sold by
Williams Hazel Rae and Williams Arnett Carroll
Bought by
Williams Hazel Rae
Create a Home Valuation Report for This Property
The Home Valuation Report is an in-depth analysis detailing your home's value as well as a comparison with similar homes in the area
Home Values in the Area
Average Home Value in this Area
Purchase History
| Date | Buyer | Sale Price | Title Company |
|---|---|---|---|
| Mayoral Javier Landin | -- | -- | |
| Aguila Jose Mayoral | -- | First Southwestern Title Co | |
| Boothe Carl | -- | First Southwestern Title Co | |
| Williams Hazel Rae | -- | -- |
Source: Public Records
Mortgage History
| Date | Status | Borrower | Loan Amount |
|---|---|---|---|
| Previous Owner | Aguila Jose Mayoral | $62,777 |
Source: Public Records
Tax History Compared to Growth
Tax History
| Year | Tax Paid | Tax Assessment Tax Assessment Total Assessment is a certain percentage of the fair market value that is determined by local assessors to be the total taxable value of land and additions on the property. | Land | Improvement |
|---|---|---|---|---|
| 2025 | $1,130 | $158,256 | $43,629 | $114,627 |
| 2024 | $1,130 | $169,404 | $43,629 | $125,775 |
| 2023 | $1,130 | $179,122 | $30,510 | $148,612 |
| 2022 | $2,479 | $146,581 | $30,510 | $116,071 |
| 2021 | $2,362 | $116,672 | $30,510 | $86,162 |
| 2020 | $2,263 | $107,619 | $30,510 | $77,109 |
| 2019 | $2,154 | $99,387 | $30,510 | $68,877 |
| 2018 | $823 | $82,335 | $14,645 | $67,690 |
| 2017 | $1,866 | $82,335 | $14,645 | $67,690 |
| 2016 | $1,796 | $82,335 | $14,645 | $67,690 |
| 2015 | $1,179 | $80,895 | $14,645 | $66,250 |
| 2014 | $1,179 | $65,492 | $14,645 | $50,847 |
Source: Public Records
Map
Nearby Homes
- 11746 Somerset Ln
- 2326 Sunny Dr
- 2306 Wardmont St
- 1925 Sunny Dr
- 11716 Innsbury Dr
- 2311 Warwick Rd
- 2131 Warwick Rd
- 2123 Warwick Rd
- 2237 Cromwell St
- 2410 Mierianne St
- 1930 Cromwell St
- 2152 William Tell St
- 1703 & 0 Sunny Dr
- 2723 Castledale Dr
- 2122 Kowis St
- 2817 Cromwell St
- 2915 Brea Crest St
- 2629 Kowis St
- 1508 Hopper Rd Unit 1
- 1802 Kowis St
- 2302 Brea Crest St
- 2230 Brea Crest St
- 2235 Mooney Rd
- 2231 Mooney Rd
- 2303 Mooney Rd
- 2306 Brea Crest St
- 2235 Brea Crest St
- 2307 Mooney Rd
- 2231 Brea Crest St
- 2227 Mooney Rd
- 2303 Brea Crest St
- 2310 Brea Crest St
- 2227 Brea Crest St
- 2222 Brea Crest St
- 2311 Mooney Rd
- 2223 Mooney Rd
- 2307 Brea Crest St
- 2223 Brea Crest St
- 2314 Brea Crest St
- 2218 Brea Crest St