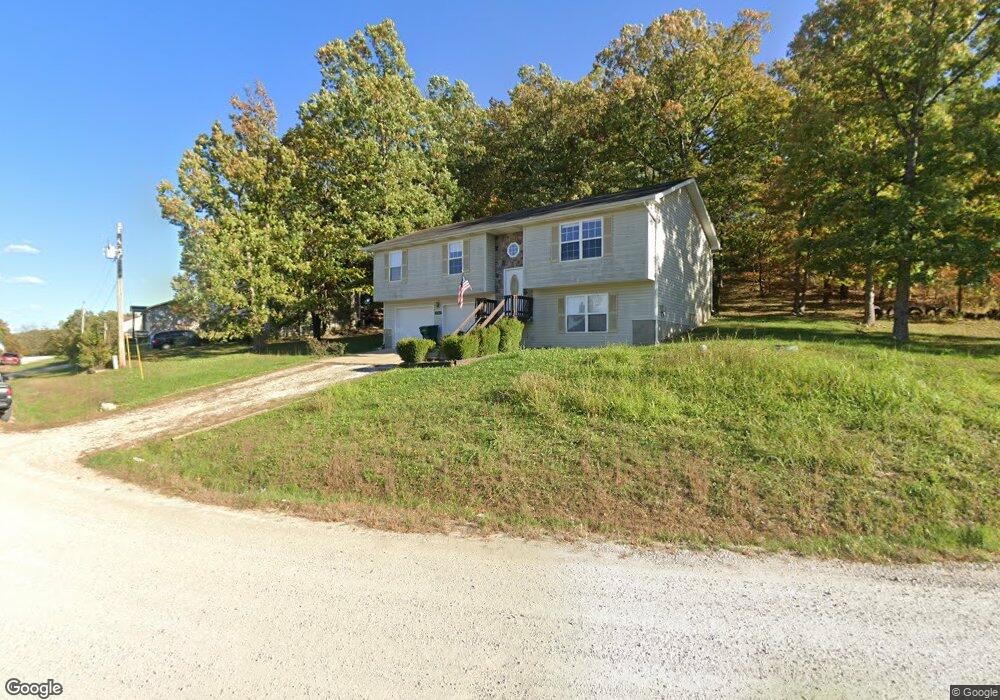
22340 Target Ln Saint Robert, MO 65584
Estimated Value: $221,000 - $256,000
4
Beds
3
Baths
2,018
Sq Ft
$118/Sq Ft
Est. Value
About This Home
This home is located at 22340 Target Ln, Saint Robert, MO 65584 and is currently estimated at $237,831, approximately $117 per square foot. 22340 Target Ln is a home located in Pulaski County with nearby schools including Freedom Elementary School, Waynesville East Elementary School, and Waynesville Sixth Grade Center.
Ownership History
Date
Name
Owned For
Owner Type
Purchase Details
Closed on
Jul 1, 2020
Bought by
Ojedokun Kunle
Current Estimated Value
Purchase Details
Closed on
Nov 30, 2009
Sold by
Moree Audey D and Moree Katrin B
Bought by
Pastor Adam A and Pastor Gina M
Home Financials for this Owner
Home Financials are based on the most recent Mortgage that was taken out on this home.
Original Mortgage
$175,187
Interest Rate
5.06%
Mortgage Type
VA
Purchase Details
Closed on
Jun 16, 2006
Sold by
Rothbauer Enterprises L L C
Bought by
Moree Audey D and Moree Katrin B
Home Financials for this Owner
Home Financials are based on the most recent Mortgage that was taken out on this home.
Original Mortgage
$165,483
Interest Rate
6.58%
Mortgage Type
VA
Purchase Details
Closed on
Jul 25, 2005
Sold by
Thiltgen Eugene and Thiltgen Helen C
Bought by
Rothbauer Enterprises Llc
Create a Home Valuation Report for This Property
The Home Valuation Report is an in-depth analysis detailing your home's value as well as a comparison with similar homes in the area
Home Values in the Area
Average Home Value in this Area
Purchase History
| Date | Buyer | Sale Price | Title Company |
|---|---|---|---|
| Ojedokun Kunle | -- | -- | |
| Pastor Adam A | -- | None Available | |
| Moree Audey D | -- | None Available | |
| Rothbauer Enterprises Llc | -- | -- |
Source: Public Records
Mortgage History
| Date | Status | Borrower | Loan Amount |
|---|---|---|---|
| Previous Owner | Pastor Adam A | $175,187 | |
| Previous Owner | Moree Audey D | $165,483 |
Source: Public Records
Tax History
| Year | Tax Paid | Tax Assessment Tax Assessment Total Assessment is a certain percentage of the fair market value that is determined by local assessors to be the total taxable value of land and additions on the property. | Land | Improvement |
|---|---|---|---|---|
| 2025 | $1,193 | $30,573 | $4,788 | $25,785 |
| 2024 | $12 | $27,431 | $3,990 | $23,441 |
| 2023 | $1,165 | $27,431 | $3,990 | $23,441 |
| 2022 | $1,075 | $27,431 | $3,990 | $23,441 |
| 2021 | $1,063 | $27,431 | $3,990 | $23,441 |
| 2020 | $1,043 | $25,593 | $0 | $0 |
| 2019 | $1,043 | $26,315 | $0 | $0 |
| 2018 | $1,042 | $26,315 | $0 | $0 |
| 2017 | $1,042 | $24,530 | $0 | $0 |
| 2016 | $989 | $26,320 | $0 | $0 |
| 2015 | $988 | $26,320 | $0 | $0 |
| 2014 | $988 | $26,320 | $0 | $0 |
Source: Public Records
Map
Nearby Homes
- 21987 Teak Ln
- 13446 Highway Z
- 105 Hillcrest Ct
- 000 Holloway Ln
- 0 Holloway Ln
- 13705 Hawksbill Dr
- 23105 Triple Ln
- 14197 Hopi Rd
- 14275 Happy Dr
- 14135 Hopi Ln
- 14395 Torpedo Dr
- 14600 Texas Rd
- 21303 Teardrop Rd
- 15025 Hackney Dr
- 15020 Hackney Dr
- 000 Texas Rd
- 22930 Hardy Ln
- 20675 Harris Ln
- 20585 Highway 28
- 20605 Highway 28
- 22340 Target Rd
- 22255 Target Rd
- 22335 Target Rd
- 22354 Target Ln
- 13990 Tassel Rd
- 22345 Target Rd
- 22245 Target Rd
- 22325 Target Rd
- 22325 Target Rd
- 13895 Tassel Rd
- 13850 Target Rd
- 22355 Target Rd
- 13870 Tassel Ln
- 13810 Tassel Rd
- 13910 Tassel Rd
- 13910 Tassel Ln
- 22315 Target Rd
- 13940 Tassel Rd
- 13458 Toffee
- 13475 Toffee Ln
Your Personal Tour Guide
Ask me questions while you tour the home.