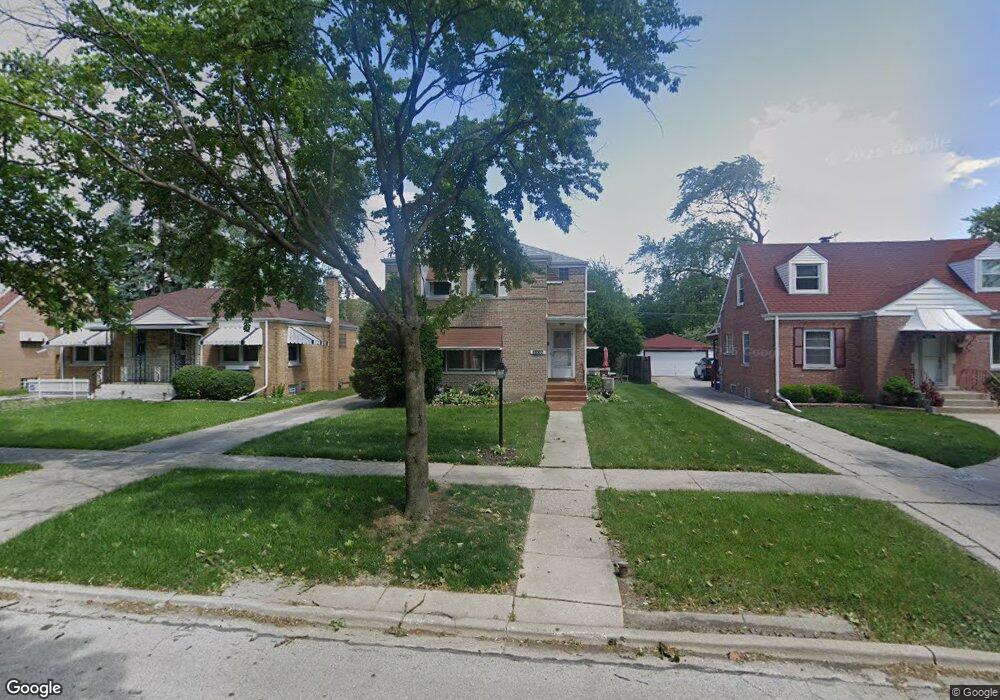
2235 S 14th Ave Broadview, IL 60155
Estimated Value: $283,600 - $293,000
3
Beds
1
Bath
1,414
Sq Ft
$204/Sq Ft
Est. Value
About This Home
This home is located at 2235 S 14th Ave, Broadview, IL 60155 and is currently estimated at $288,900, approximately $204 per square foot. 2235 S 14th Ave is a home located in Cook County with nearby schools including Lindop Elementary School, Proviso East High School, and Maywood Margery Daw Day Care.
Ownership History
Date
Name
Owned For
Owner Type
Purchase Details
Closed on
Mar 2, 2006
Sold by
Hampton Bennie
Bought by
Hampton Bennie and Hampton Luberta
Current Estimated Value
Home Financials for this Owner
Home Financials are based on the most recent Mortgage that was taken out on this home.
Original Mortgage
$221,500
Interest Rate
7.99%
Mortgage Type
Unknown
Purchase Details
Closed on
Sep 29, 2004
Sold by
Hampton Luberta
Bought by
Hampton Bennie
Home Financials for this Owner
Home Financials are based on the most recent Mortgage that was taken out on this home.
Original Mortgage
$165,600
Interest Rate
5.87%
Mortgage Type
New Conventional
Create a Home Valuation Report for This Property
The Home Valuation Report is an in-depth analysis detailing your home's value as well as a comparison with similar homes in the area
Home Values in the Area
Average Home Value in this Area
Purchase History
| Date | Buyer | Sale Price | Title Company |
|---|---|---|---|
| Hampton Bennie | -- | Stewart Title Of Illinois | |
| Hampton Bennie | -- | Ticor Title |
Source: Public Records
Mortgage History
| Date | Status | Borrower | Loan Amount |
|---|---|---|---|
| Closed | Hampton Bennie | $221,500 | |
| Closed | Hampton Bennie | $165,600 | |
| Closed | Hampton Bennie | $41,400 |
Source: Public Records
Tax History
| Year | Tax Paid | Tax Assessment Tax Assessment Total Assessment is a certain percentage of the fair market value that is determined by local assessors to be the total taxable value of land and additions on the property. | Land | Improvement |
|---|---|---|---|---|
| 2025 | $1,984 | $24,000 | $3,685 | $20,315 |
| 2024 | $1,984 | $24,000 | $3,685 | $20,315 |
| 2023 | $2,535 | $24,000 | $3,685 | $20,315 |
| 2022 | $2,535 | $18,327 | $2,680 | $15,647 |
| 2021 | $2,337 | $18,327 | $2,680 | $15,647 |
| 2020 | $2,112 | $18,327 | $2,680 | $15,647 |
| 2019 | $2,599 | $15,178 | $2,512 | $12,666 |
| 2018 | $2,606 | $15,178 | $2,512 | $12,666 |
| 2017 | $2,522 | $15,178 | $2,512 | $12,666 |
| 2016 | $3,733 | $13,444 | $2,345 | $11,099 |
| 2015 | $3,875 | $13,444 | $2,345 | $11,099 |
| 2014 | $3,050 | $13,444 | $2,345 | $11,099 |
| 2013 | $4,483 | $15,968 | $2,345 | $13,623 |
Source: Public Records
Map
Nearby Homes
- 2305 S 15th Ave
- 2218 S 11th Ave
- 2316 S 10th Ave
- 2036 S 15th Ave
- 2114 S 10th Ave
- 2204 S 9th Ave Unit 2
- 2433 S 17th Ave
- 2001 S 11th Ave
- 2510 S 17th Ave
- 1924 S 17th Ave
- 2247 S 21st Ave
- 2025 S 8th Ave
- 1911 S 11th Ave
- 2105 S 7th Ave
- 2616 S 12th Ave
- 1918 S 9th Ave
- 2116 S 21st Ave
- 1119 W Roosevelt Rd
- 1830 S 11th Ave
- 1917 S 9th Ave
- 2239 S 14th Ave
- 2231 S 14th Ave
- 2243 S 14th Ave
- 2227 S 14th Ave
- 2234 S 13th Ave
- 2238 S 13th Ave
- 2230 S 13th Ave
- 2223 S 14th Ave
- 2247 S 14th Ave
- 2242 S 13th Ave
- 2226 S 13th Ave
- 2234 S 14th Ave
- 2219 S 14th Ave
- 2251 S 14th Ave
- 2246 S 13th Ave
- 2222 S 13th Ave
- 2230 S 14th Ave
- 2238 S 14th Ave
- 2226 S 14th Ave
- 2242 S 14th Ave
Your Personal Tour Guide
Ask me questions while you tour the home.