Estimated Value: $366,000 - $404,000
3
Beds
1
Bath
1,846
Sq Ft
$209/Sq Ft
Est. Value
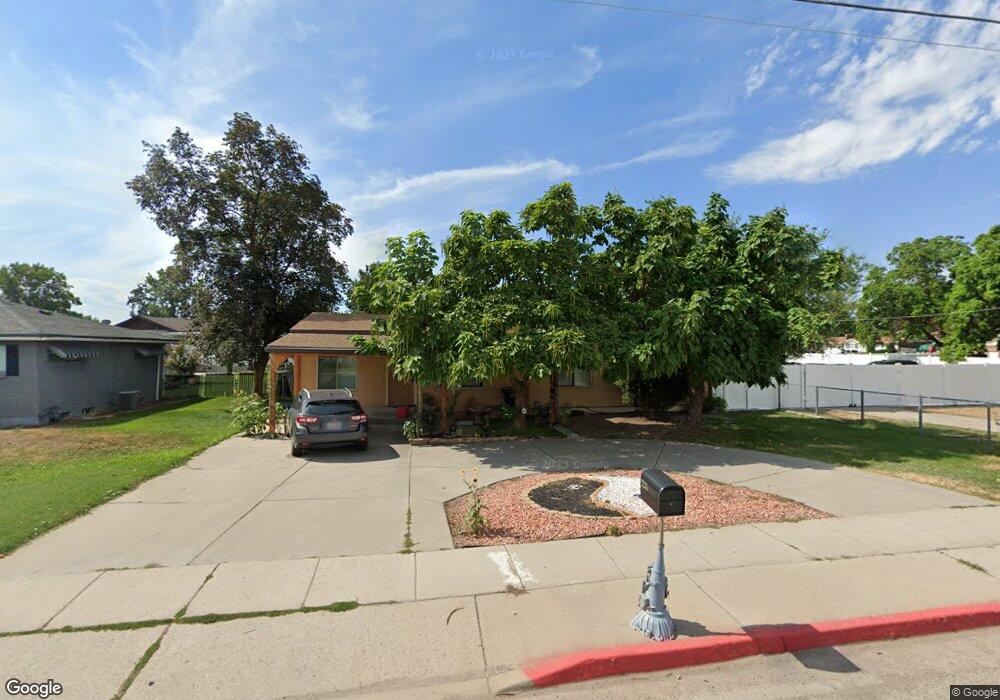
About This Home
This home is located at 2235 W 4800 S, Roy, UT 84067 and is currently estimated at $386,253, approximately $209 per square foot. 2235 W 4800 S is a home located in Weber County with nearby schools including Lakeview Elementary School, Roy Junior High School, and Roy High School.
Ownership History
Date
Name
Owned For
Owner Type
Purchase Details
Closed on
Mar 23, 2017
Sold by
Oseguera Juan R and Oseguera Ingrid E
Bought by
Lopez Juan R Oseguera and Oseguera Ingrid
Current Estimated Value
Home Financials for this Owner
Home Financials are based on the most recent Mortgage that was taken out on this home.
Original Mortgage
$124,000
Interest Rate
4.17%
Mortgage Type
New Conventional
Purchase Details
Closed on
Oct 7, 2009
Sold by
Oseguera Juan R and Oseguera Ingrid E
Bought by
Oseguera Juan R and Oseguera Ingrid E
Home Financials for this Owner
Home Financials are based on the most recent Mortgage that was taken out on this home.
Original Mortgage
$104,000
Interest Rate
5.02%
Mortgage Type
New Conventional
Create a Home Valuation Report for This Property
The Home Valuation Report is an in-depth analysis detailing your home's value as well as a comparison with similar homes in the area
Home Values in the Area
Average Home Value in this Area
Purchase History
| Date | Buyer | Sale Price | Title Company |
|---|---|---|---|
| Lopez Juan R Oseguera | -- | First American Title Ins Co | |
| Oseguera Juan R | -- | Nations Title Agency Inc |
Source: Public Records
Mortgage History
| Date | Status | Borrower | Loan Amount |
|---|---|---|---|
| Closed | Lopez Juan R Oseguera | $124,000 | |
| Closed | Oseguera Juan R | $104,000 |
Source: Public Records
Tax History
| Year | Tax Paid | Tax Assessment Tax Assessment Total Assessment is a certain percentage of the fair market value that is determined by local assessors to be the total taxable value of land and additions on the property. | Land | Improvement |
|---|---|---|---|---|
| 2025 | $2,232 | $339,462 | $121,661 | $217,801 |
| 2024 | $2,130 | $178,749 | $66,914 | $111,835 |
| 2023 | $2,083 | $175,450 | $61,666 | $113,784 |
| 2022 | $2,271 | $199,100 | $55,579 | $143,521 |
| 2021 | $1,768 | $251,000 | $68,003 | $182,997 |
| 2020 | $1,596 | $207,000 | $68,003 | $138,997 |
| 2019 | $1,497 | $182,000 | $41,407 | $140,593 |
| 2018 | $1,336 | $151,000 | $38,239 | $112,761 |
| 2017 | $1,219 | $128,000 | $38,239 | $89,761 |
| 2016 | $1,136 | $63,732 | $18,220 | $45,512 |
| 2015 | $1,073 | $61,609 | $18,220 | $43,389 |
| 2014 | $1,023 | $57,709 | $15,740 | $41,969 |
Source: Public Records
Map
Nearby Homes
- 4881 S 2400 W
- 2038 W 4600 S
- 5024 S 2575 W
- 5185 S 2100 W
- 2581 W 5000 S
- 5243 S 2200 W
- 5261 S 2200 W
- 1838 W 5050 S
- 4642 S 1900 W Unit 41
- 1829 W 5050 S
- 5289 S 2200 W
- 5125 S 2600 W
- 1783 W 5000 S
- 1789 W 5050 S
- 4602 Hathaway Dr
- 1765 W 5000 S
- 1779 W 5125 S
- 4732 S West Park Dr
- 4328 S 2175 W
- 4598 S Blossom Glen Way
Your Personal Tour Guide
Ask me questions while you tour the home.