


2236 Clay Rd Austell, GA 30106
Estimated payment $1,176/month
Highlights
- Very Popular Property
- In Ground Pool
- Private Yard
- Clarkdale Elementary School Rated A-
- Mud Room
- Cottage
About This Home
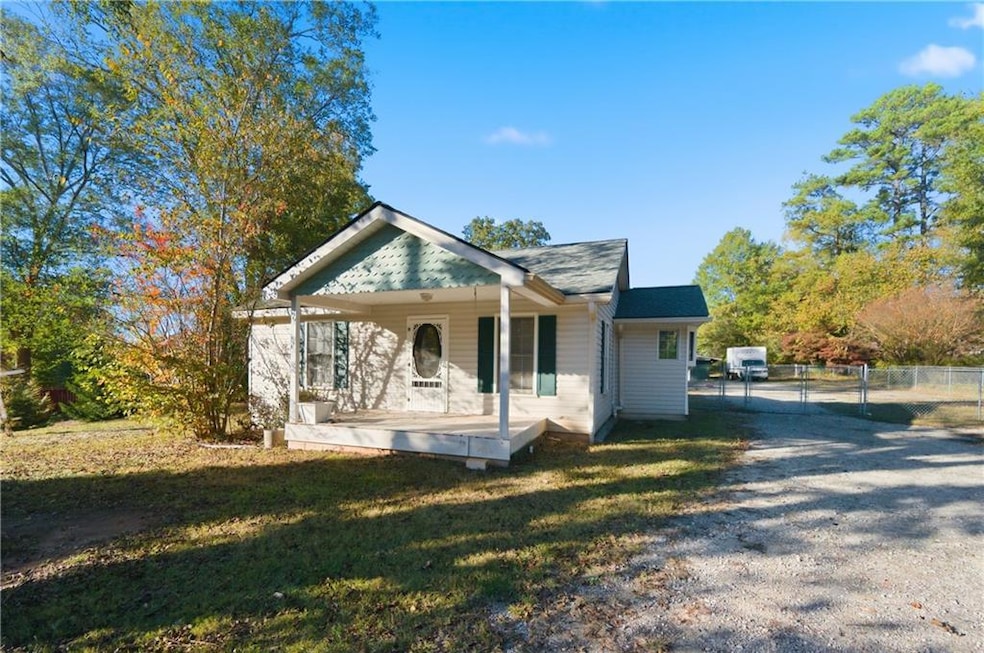
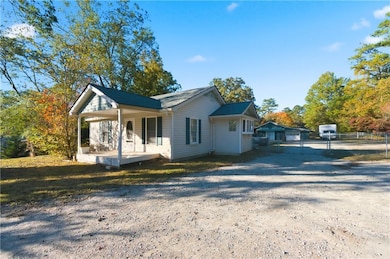
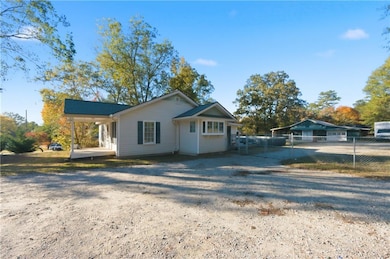
Charming Bungalow on Spacious Half-Acre Lot Welcome home to this cozy bungalow-style retreat featuring 1 bedroom, 1.5 baths, and an additional flex room that can easily serve as a second bedroom or office. The inviting family room, filled with natural light, creates the perfect space for relaxing evenings, while the eat-in dining area with a stone fireplace offers a warm and welcoming atmosphere for gatherings. Enjoy beautiful hardwood floors, a convenient mudroom, and updated bathrooms throughout. The home sits on a generous half-acre lot with an above-ground pool, a deck overlooking the backyard, and ample parking for guests. A detached garage with storage, plus an additional storage shed, provides abundant space for hobbies or equipment. Recent upgrades include a new HVAC system, water heater, and roof—offering peace of mind for years to come. The property is served by a private septic system and is ideally located near schools, shopping, interstates, and the Silver Comet Trail. This charming bungalow blends comfort, convenience, and character—perfect for a private getaway or a smart investment opportunity.
Listing Agent
Keller Williams Realty Signature Partners License #254122 Listed on: 11/07/2025

Home Details
Home Type
- Single Family
Est. Annual Taxes
- $1,483
Year Built
- Built in 1950
Lot Details
- 0.5 Acre Lot
- Chain Link Fence
- Level Lot
- Private Yard
- Back Yard
Parking
- 1 Car Detached Garage
Home Design
- Cottage
- Slab Foundation
- Composition Roof
Interior Spaces
- 1,152 Sq Ft Home
- 1.5-Story Property
- Brick Fireplace
- Mud Room
- Workshop
- Fire and Smoke Detector
- Gas Cooktop
- Laundry in Mud Room
Bedrooms and Bathrooms
- 1 Main Level Bedroom
- Bathtub and Shower Combination in Primary Bathroom
Outdoor Features
- In Ground Pool
- Covered Patio or Porch
Location
- Property is near schools
Schools
- Clarkdale Elementary School
- Cooper Middle School
- South Cobb High School
Utilities
- Central Air
- Heating System Uses Natural Gas
- Underground Utilities
- Septic Tank
Community Details
- Homesite Subdivision
Listing and Financial Details
- Assessor Parcel Number 19113900030
Map
Home Values in the Area
Average Home Value in this Area
Tax History
| Year | Tax Paid | Tax Assessment Tax Assessment Total Assessment is a certain percentage of the fair market value that is determined by local assessors to be the total taxable value of land and additions on the property. | Land | Improvement |
|---|---|---|---|---|
| 2025 | $1,483 | $69,696 | $30,608 | $39,088 |
| 2024 | $1,484 | $69,696 | $30,608 | $39,088 |
| 2023 | $701 | $58,588 | $28,996 | $29,592 |
| 2022 | $1,055 | $49,524 | $19,332 | $30,192 |
| 2021 | $802 | $37,960 | $14,500 | $23,460 |
| 2020 | $802 | $37,960 | $14,500 | $23,460 |
| 2019 | $745 | $35,380 | $11,920 | $23,460 |
| 2018 | $674 | $32,108 | $10,956 | $21,152 |
| 2017 | $574 | $28,884 | $7,732 | $21,152 |
| 2016 | $575 | $28,884 | $7,732 | $21,152 |
| 2015 | $591 | $28,884 | $7,732 | $21,152 |
| 2014 | $371 | $21,304 | $0 | $0 |
Property History
| Date | Event | Price | List to Sale | Price per Sq Ft |
|---|---|---|---|---|
| 11/07/2025 11/07/25 | For Sale | $199,900 | -- | $174 / Sq Ft |
Purchase History
| Date | Type | Sale Price | Title Company |
|---|---|---|---|
| Warranty Deed | -- | -- | |
| Warranty Deed | $79,000 | -- | |
| Deed | $87,000 | -- | |
| Warranty Deed | -- | -- |
Mortgage History
| Date | Status | Loan Amount | Loan Type |
|---|---|---|---|
| Open | $75,050 | New Conventional | |
| Closed | $75,050 | New Conventional | |
| Previous Owner | $67,000 | New Conventional | |
| Previous Owner | $3,684 | New Conventional |
Source: First Multiple Listing Service (FMLS)
MLS Number: 7677451
APN: 19-1139-0-003-0
Disclaimer: Certain information contained herein is derived from information provided by parties other than Homes.com. All information provided is deemed reliable, but is not guaranteed to be accurate and should be independently verified.
![]() Listings identified with the FMLS IDX logo come from FMLS and are held by brokerage firms other than the owner of this website. The listing brokerage is identified in any listing details. Information is deemed reliable but is not guaranteed. If you believe any FMLS listing contains material that infringes your copyrighted work please visit www.fmls.com/dmca to review our DMCA policy and learn how to submit a takedown request. © 2025 First Multiple Listing Service, Inc.
Listings identified with the FMLS IDX logo come from FMLS and are held by brokerage firms other than the owner of this website. The listing brokerage is identified in any listing details. Information is deemed reliable but is not guaranteed. If you believe any FMLS listing contains material that infringes your copyrighted work please visit www.fmls.com/dmca to review our DMCA policy and learn how to submit a takedown request. © 2025 First Multiple Listing Service, Inc.
- 2125 Clay Rd SW
- 2331 Weslan Dr
- 5069 Flint Hill Rd Unit AB
- 5069 A B Flint Hill Rd
- 4809 Hemlock Dr
- 5164 Medford Ln
- 5154 Medford Ln
- 6025 Park Wood Ct
- 2540 Park Ave
- 2349 Shire Ct
- 2373 Buckley Ct
- 2415 Wales Dr
- 2136 Perkerson Mill Rd SW
- 2650 Park Ave
- 4821 Madison Point Cir
- 2110 Plum Ln
- 4598 Flint Hill Rd
- 1943 Arnold Dr
- 4910 Springdale Rd
- 4867 Flint Hill Rd SW
- 2020 Annette Ln SW
- 2549 Dogwood Hills Ct Unit BASEMENT
- 2424 Anderson Mill Rd
- 4713 Nature Trail
- 2433 Anderson Mill Rd
- 2753 Whitewater Ct
- 2719 Greystone Ct
- 2085 Lenoa Ln
- 2061 Chesley Dr
- 1847 Elmwood Dr
- 2796 Water Valley Rd
- 1584 Silver Ridge Dr
- 2105 Mesa Valley Way
- 2460 Washington St
- 1577 Silver Ridge Dr SW
- 2460 Ravencliff Dr
- 5337 Burrus Ln
- 4236 Austell Rd