
2236 Johnson Creek Rd Cascade, ID 83611
Estimated payment $4,070/month
Total Views
12,402
10
Acres
$72,900
Price per Acre
435,600
Sq Ft Lot
About This Lot
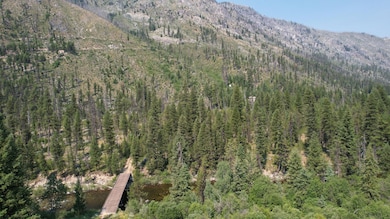
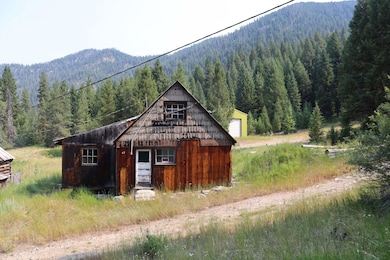
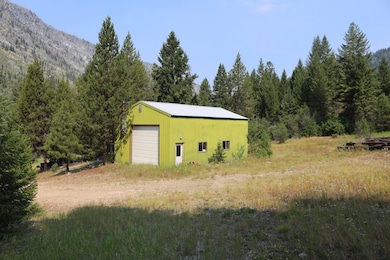
This 10 acre parcel comprises three summer cabins in need of renovation along with a workshop. The workshop comes complete with an overhead door, cement floor, power supply, and wood stove. The condition of the septic system is unknown. One possibility is to renovate the cabins to establish multiple living spaces, while the workshop can be repurposed for storing recreational equipment and tools. The property offers direct access from Johnson Creek Road and is equipped w/ power infrastructure. For additional details and photos please click on the property website below.
Listing Provided By

Property Details
Property Type
- Land
Est. Annual Taxes
- $528
Lot Details
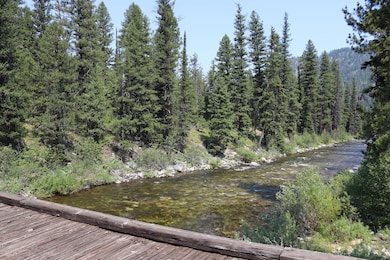
- Fishing include trout, salmon
- Dirt Road
- Wooded Lot
- Few Trees
- Current uses include hunting/fishing
- Potential uses include hunting/fishing
Outdoor Features
- Wildlife includes elk, mule deer, quails, pheasants, moose, bears
Map
Create a Home Valuation Report for This Property
The Home Valuation Report is an in-depth analysis detailing your home's value as well as a comparison with similar homes in the area
Home Values in the Area
Average Home Value in this Area
Tax History
| Year | Tax Paid | Tax Assessment Tax Assessment Total Assessment is a certain percentage of the fair market value that is determined by local assessors to be the total taxable value of land and additions on the property. | Land | Improvement |
|---|---|---|---|---|
| 2023 | $528 | $161,446 | $86,745 | $74,701 |
| 2022 | $505 | $147,893 | $85,045 | $62,848 |
| 2021 | $686 | $144,106 | $37,425 | $106,681 |
| 2020 | $527 | $86,240 | $29,745 | $56,495 |
| 2019 | $516 | $75,237 | $28,845 | $46,392 |
| 2018 | $557 | $82,510 | $37,080 | $45,430 |
| 2017 | $585 | $82,150 | $36,720 | $45,430 |
| 2016 | $633 | $88,632 | $36,720 | $51,912 |
| 2015 | $284 | $73,723 | $0 | $0 |
| 2013 | -- | $68,266 | $0 | $0 |
Source: Public Records
Property History
| Date | Event | Price | Change | Sq Ft Price |
|---|---|---|---|---|
| 12/09/2024 12/09/24 | For Sale | $729,000 | 0.0% | $1,458 / Sq Ft |
| 12/14/2023 12/14/23 | For Sale | $729,000 | -- | -- |
Nearby Homes
- 0 Johnson Creek Rd
- TBD Johnson Creek Rd
- 1204 Porcupine Rd
- 230 Upper Murray Creek Rd
- TBD Secesh River Rd
- 8 Haymaker Place
- 14106 Penne Lane Rd Unit 3
- 8 Haymaker Place Unit 61
- 90 Ridgeview Rd
- Lot 60 River Ranch Ct
- tbd Paddy Flat Rd
- 227 Paddy Flat Rd
- 0 Warren Creek Rd
- 24743 Wagon Wheel Rd
- 24743 Warren Wagon Rd
- 24616 Warren Wagon Rd
- 9261 Sheep Mountain Rd Unit LotWP001
- 9261 Sheep Mountain Rd