
Landlord's Agent in 2025
Tamar Rapaport
Keller Williams Town Life
(201) 665-5558
2 in this area
92 Total Sales
Estimated Value: $515,000 - $584,000
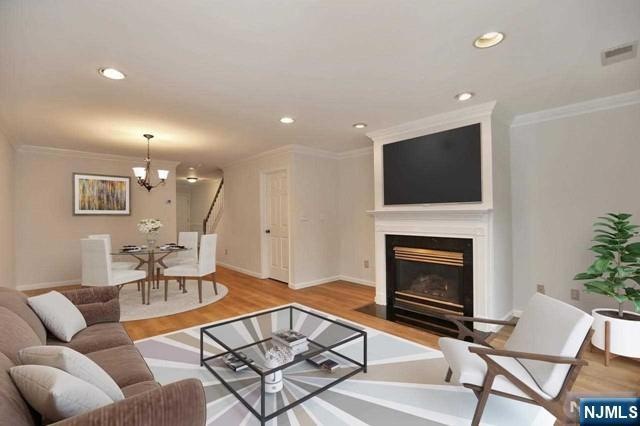
Welcome to Franklin Heights! Easy living and conveniently located near shopping and major highways. The property offers entry foyer, living room with fireplace and balcony, dining area, and updated kitchen.2nd floor features master bedroom w/ master bath, large second bedroom, hall bath and laundry. All wood floors. Lower level is finished and can be used as office or playroom. Utilize the outdoor pool and tennis courts this summer! Simply unpack and enjoy!
| Date | Buyer | Sale Price | Title Company |
|---|---|---|---|
| Locascio Lynn | $214,000 | Chicago Title Insurance Co | |
| Lopez Sandra M | $170,275 | -- |
| Date | Status | Borrower | Loan Amount |
|---|---|---|---|
| Open | Locascio Lynn | $134,000 | |
| Previous Owner | Lopez Sandra M | $161,000 |
| Date | Event | Price | List to Sale | Price per Sq Ft |
|---|---|---|---|---|
| 02/13/2025 02/13/25 | Rented | -- | -- | -- |
| 01/27/2025 01/27/25 | For Rent | $3,350 | +1.5% | -- |
| 08/12/2022 08/12/22 | Rented | $3,300 | +1.5% | -- |
| 08/01/2022 08/01/22 | For Rent | $3,250 | -- | -- |
| Year | Tax Paid | Tax Assessment Tax Assessment Total Assessment is a certain percentage of the fair market value that is determined by local assessors to be the total taxable value of land and additions on the property. | Land | Improvement |
|---|---|---|---|---|
| 2025 | $6,883 | $333,500 | $205,000 | $128,500 |
| 2024 | $6,793 | $333,500 | $205,000 | $128,500 |
| 2023 | $6,577 | $333,500 | $205,000 | $128,500 |
| 2022 | $6,577 | $333,500 | $205,000 | $128,500 |
| 2021 | $6,507 | $333,500 | $205,000 | $128,500 |
| 2020 | $6,350 | $333,500 | $205,000 | $128,500 |
| 2019 | $6,140 | $333,500 | $205,000 | $128,500 |
| 2018 | $6,053 | $333,500 | $205,000 | $128,500 |
| 2017 | $5,956 | $333,500 | $205,000 | $128,500 |
| 2016 | $5,826 | $333,500 | $205,000 | $128,500 |
| 2015 | $5,746 | $333,500 | $205,000 | $128,500 |
| 2014 | $5,649 | $333,500 | $205,000 | $128,500 |
Landlord's Agent in 2025
Tamar Rapaport
Keller Williams Town Life
(201) 665-5558
2 in this area
92 Total Sales
Tenant's Agent in 2025
Lori Bennett
United Real Estate
(201) 956-4571
27 Total Sales
A
Buyer Co-Listing Agent in 2025
Ann Marie Cimiluca
United Real Estate
(201) 788-4013
15 Total Sales
Seller Co-Listing Agent in 2022
Bahr Rapaport
Keller Williams Town Life
(917) 848-1784
84 Total Sales
Buyer's Agent in 2022
Rosemary Carroll
United Real Estate
(201) 315-9854
12 Total Sales
Source: New Jersey MLS
MLS Number: 25000712
APN: 33-00070-0000-02236
Disclaimer: Certain information contained herein is derived from information provided by parties other than Homes.com. All information provided is deemed reliable, but is not guaranteed to be accurate and should be independently verified.
![]() The data relating to the real estate for sale on this web site comes in part from the Internet Data Exchange Program of the NJMLS. Real estate listings held by brokerage firms other than Ten-X are marked with the Internet Data Exchange logo and information about them includes the name of the listing brokers. Some properties listed with the participating brokers do not appear on this website at the request of the seller. Listings of brokers that do not participate in Internet Data Exchange do not appear on this website.
The data relating to the real estate for sale on this web site comes in part from the Internet Data Exchange Program of the NJMLS. Real estate listings held by brokerage firms other than Ten-X are marked with the Internet Data Exchange logo and information about them includes the name of the listing brokers. Some properties listed with the participating brokers do not appear on this website at the request of the seller. Listings of brokers that do not participate in Internet Data Exchange do not appear on this website.
All information deemed reliable but not guaranteed. Source: New Jersey Multiple Listing, Inc.
© 2025 New Jersey Multiple Listing Service Inc. All rights reserved.