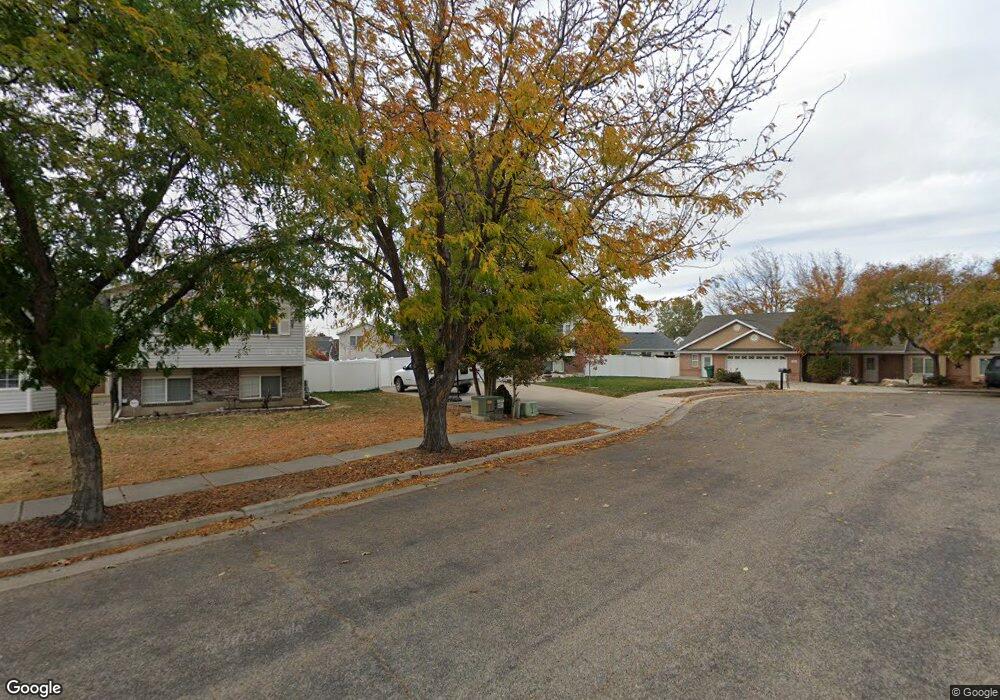
2236 N 450 W Clearfield, UT 84015
Estimated Value: $382,044 - $404,000
4
Beds
2
Baths
975
Sq Ft
$402/Sq Ft
Est. Value
About This Home
This home is located at 2236 N 450 W, Clearfield, UT 84015 and is currently estimated at $391,761, approximately $401 per square foot. 2236 N 450 W is a home located in Davis County with nearby schools including Sunset School, Sunset Junior High School, and Northridge High School.
Ownership History
Date
Name
Owned For
Owner Type
Purchase Details
Closed on
Jan 16, 2019
Sold by
Evn Property Development Llc
Bought by
Gaines Richard L
Current Estimated Value
Home Financials for this Owner
Home Financials are based on the most recent Mortgage that was taken out on this home.
Original Mortgage
$301,000
Outstanding Balance
$265,175
Interest Rate
4.7%
Mortgage Type
VA
Estimated Equity
$126,586
Purchase Details
Closed on
Jan 20, 2010
Sold by
Andrews Sandra K
Bought by
Andrews Sandra K
Home Financials for this Owner
Home Financials are based on the most recent Mortgage that was taken out on this home.
Original Mortgage
$166,361
Interest Rate
5.5%
Mortgage Type
FHA
Purchase Details
Closed on
Dec 22, 2006
Sold by
Andrews Sandra K
Bought by
Andrews Sandra K
Home Financials for this Owner
Home Financials are based on the most recent Mortgage that was taken out on this home.
Original Mortgage
$160,397
Interest Rate
6.22%
Mortgage Type
New Conventional
Create a Home Valuation Report for This Property
The Home Valuation Report is an in-depth analysis detailing your home's value as well as a comparison with similar homes in the area
Home Values in the Area
Average Home Value in this Area
Purchase History
| Date | Buyer | Sale Price | Title Company |
|---|---|---|---|
| Gaines Richard L | -- | Advanced Title Ins Agency | |
| Andrews Sandra K | -- | Absolute Title Ins Agency | |
| Andrews Sandra K | -- | Executive Title Ins Agency |
Source: Public Records
Mortgage History
| Date | Status | Borrower | Loan Amount |
|---|---|---|---|
| Open | Gaines Richard L | $301,000 | |
| Previous Owner | Andrews Sandra K | $166,361 | |
| Previous Owner | Andrews Sandra K | $160,397 |
Source: Public Records
Tax History
| Year | Tax Paid | Tax Assessment Tax Assessment Total Assessment is a certain percentage of the fair market value that is determined by local assessors to be the total taxable value of land and additions on the property. | Land | Improvement |
|---|---|---|---|---|
| 2025 | $2,225 | $202,950 | $72,833 | $130,117 |
| 2024 | $2,014 | $183,700 | $69,600 | $114,100 |
| 2023 | $1,900 | $316,000 | $110,958 | $205,042 |
| 2022 | $2,016 | $181,500 | $63,241 | $118,259 |
| 2021 | $1,739 | $246,000 | $69,276 | $176,724 |
| 2020 | $1,516 | $211,000 | $58,665 | $152,335 |
| 2019 | $1,429 | $204,000 | $72,648 | $131,352 |
| 2018 | $1,267 | $177,000 | $58,057 | $118,943 |
| 2016 | $1,094 | $78,540 | $27,460 | $51,080 |
| 2015 | $1,074 | $73,040 | $27,460 | $45,580 |
| 2014 | $990 | $68,841 | $27,460 | $41,381 |
| 2013 | -- | $60,309 | $23,265 | $37,044 |
Source: Public Records
Map
Nearby Homes
- 345 W 2300 N
- 2358 N 400 W
- 2413 N 475 W
- 2129 N 250 W
- 2001 N 400 W
- 706 W 2300 N
- 2512 N 475 W
- 158 W 2200 N
- 129 W 2200 N
- 2237 N 125 W
- 2597 N 500 W
- 1874 N 300 W
- 782 W 1960 N
- 2085 N Main St Unit 309
- 2085 N Main St Unit 102
- 2085 N Main St Unit 409
- 2085 N Main St Unit 107
- 2085 N Main St Unit 108
- 2085 N Main St Unit 115
- 2085 N Main St Unit 110
Your Personal Tour Guide
Ask me questions while you tour the home.