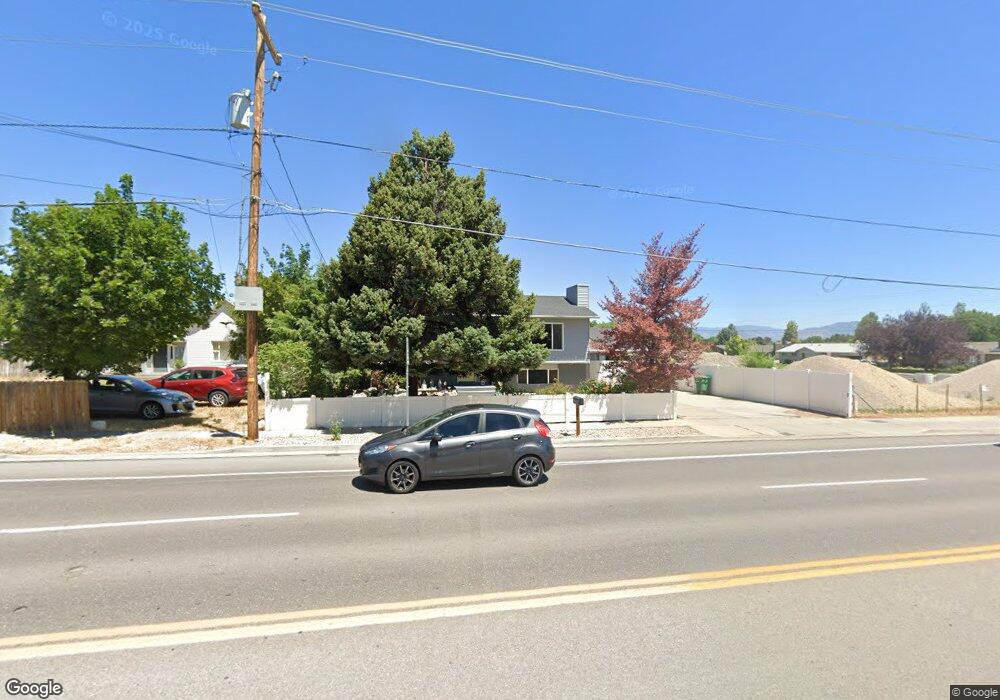
2236 W 7000 S West Jordan, UT 84084
Estimated Value: $458,000 - $529,000
4
Beds
2
Baths
1,028
Sq Ft
$488/Sq Ft
Est. Value
About This Home
This home is located at 2236 W 7000 S, West Jordan, UT 84084 and is currently estimated at $501,256, approximately $487 per square foot. 2236 W 7000 S is a home located in Salt Lake County with nearby schools including West Jordan School, Majestic Elementary Arts Academy, and West Jordan Middle School.
Ownership History
Date
Name
Owned For
Owner Type
Purchase Details
Closed on
May 15, 2014
Sold by
City Creek Reserve Inc
Bought by
Salt Lake County
Current Estimated Value
Purchase Details
Closed on
Mar 28, 2006
Sold by
Rodriguez Gabriel and Rodriguez Ofelia
Bought by
Rodriguez Gabriel and Rodriguez Ofelia
Home Financials for this Owner
Home Financials are based on the most recent Mortgage that was taken out on this home.
Original Mortgage
$117,618
Interest Rate
6.25%
Mortgage Type
FHA
Purchase Details
Closed on
Oct 22, 1998
Sold by
Garcia Irma
Bought by
Rodriquez Gabriel and Rodriquez Ofelia
Purchase Details
Closed on
Jul 11, 1996
Sold by
Leader Everett W
Bought by
Rodriquez Gabriel and Rodriquez Ofelia
Home Financials for this Owner
Home Financials are based on the most recent Mortgage that was taken out on this home.
Original Mortgage
$121,882
Interest Rate
8.03%
Mortgage Type
FHA
Create a Home Valuation Report for This Property
The Home Valuation Report is an in-depth analysis detailing your home's value as well as a comparison with similar homes in the area
Home Values in the Area
Average Home Value in this Area
Purchase History
| Date | Buyer | Sale Price | Title Company |
|---|---|---|---|
| Salt Lake County | -- | None Available | |
| Rodriguez Gabriel | -- | Equity Title | |
| Rodriquez Gabriel | -- | -- | |
| Rodriquez Gabriel | -- | -- |
Source: Public Records
Mortgage History
| Date | Status | Borrower | Loan Amount |
|---|---|---|---|
| Previous Owner | Rodriguez Gabriel | $117,618 | |
| Previous Owner | Rodriquez Gabriel | $121,882 |
Source: Public Records
Tax History Compared to Growth
Tax History
| Year | Tax Paid | Tax Assessment Tax Assessment Total Assessment is a certain percentage of the fair market value that is determined by local assessors to be the total taxable value of land and additions on the property. | Land | Improvement |
|---|---|---|---|---|
| 2025 | $2,246 | $464,800 | $138,000 | $326,800 |
| 2024 | $2,246 | $432,100 | $132,600 | $299,500 |
| 2023 | $2,216 | $401,900 | $131,400 | $270,500 |
| 2022 | $2,280 | $406,700 | $128,800 | $277,900 |
| 2021 | $1,842 | $299,100 | $107,300 | $191,800 |
| 2020 | $1,841 | $280,500 | $107,300 | $173,200 |
| 2019 | $1,775 | $265,200 | $90,100 | $175,100 |
| 2018 | $1,556 | $230,600 | $88,900 | $141,700 |
| 2017 | $1,450 | $214,000 | $88,900 | $125,100 |
| 2016 | $1,419 | $196,700 | $84,000 | $112,700 |
| 2015 | $1,351 | $182,600 | $85,500 | $97,100 |
| 2014 | $1,230 | $163,700 | $77,500 | $86,200 |
Source: Public Records
Map
Nearby Homes
- 6924 S 2160 W
- 2312 W Hidden Bend Cove Unit 107
- 2421 W 6900 S
- 6925 S Lexington Dr
- 1951 W 7125 S
- 7150 Camelot Way
- 7149 S Camelot Way
- 6918 S Harvest Cir
- 2683 W Carson Ln
- 7279 S Kenadi Ct
- 6683 Alice Susanna Ln
- 1718 W Trey Way Unit 2
- 2510 W Jordan Meadows Ln
- 7361 S 2700 W
- 2573 Jordan Meadows Ln
- 1607 W Beamon St
- 2333 W Ledgewood Dr
- 7118 S Equator Ln Unit 14 B
- 8524 S Michele River Ave W Unit 109
- 2169 W 7600 S
- 2210 W 7000 Rd S
- 2246 W 7000 S
- 2247 W Mya Nichol Cir
- 2247 Mya Nichol Cir
- 2253 W Mya Nichol Cir
- 2270 W 7000 S
- 2270 W 7000 S Unit 2270 W 7000 S Unit 1
- 2231 Mya Nichol Cir
- 2231 W Mya Nichol Cir
- 2267 W Mya Nichol Cir
- 2227 W 7000 S
- 7014 S 2200 W
- 6987 S 2200 W
- 2295 W 7000 S
- 6975 S 2200 W
- 2266 Mya Nichol Cir
- 6963 S 2200 W
- 6971 S 2320 W
- 2248 Mya Nichol Cir
- 2248 Mya Nichol Cir Unit 2