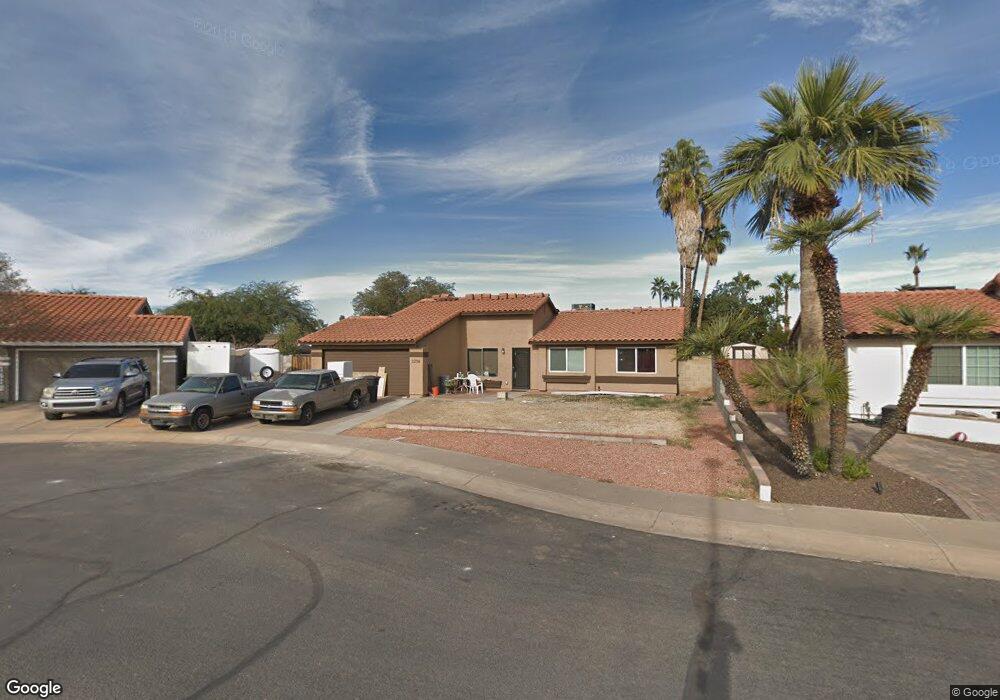
2236 W Manor St Chandler, AZ 85224
Central Ridge NeighborhoodEstimated Value: $348,743 - $451,000
--
Bed
2
Baths
1,289
Sq Ft
$317/Sq Ft
Est. Value
About This Home
This home is located at 2236 W Manor St, Chandler, AZ 85224 and is currently estimated at $408,936, approximately $317 per square foot. 2236 W Manor St is a home located in Maricopa County with nearby schools including Chandler Traditional Academy - Goodman, Andersen Junior High School, and Chandler High School.
Ownership History
Date
Name
Owned For
Owner Type
Purchase Details
Closed on
Nov 17, 2018
Sold by
Johnson Michael T
Bought by
Johnson Michael T and Johnson Paul T
Current Estimated Value
Purchase Details
Closed on
Mar 17, 1997
Sold by
Stubbs William A and Stubbs Paula K
Bought by
Johnson Michael T
Home Financials for this Owner
Home Financials are based on the most recent Mortgage that was taken out on this home.
Original Mortgage
$94,556
Outstanding Balance
$11,589
Interest Rate
7.86%
Mortgage Type
New Conventional
Estimated Equity
$397,347
Create a Home Valuation Report for This Property
The Home Valuation Report is an in-depth analysis detailing your home's value as well as a comparison with similar homes in the area
Home Values in the Area
Average Home Value in this Area
Purchase History
| Date | Buyer | Sale Price | Title Company |
|---|---|---|---|
| Johnson Michael T | -- | Title Source Inc | |
| Johnson Paul T | -- | Title Source Inc | |
| Johnson Michael T | $95,000 | Ati Title Agency |
Source: Public Records
Mortgage History
| Date | Status | Borrower | Loan Amount |
|---|---|---|---|
| Open | Johnson Michael T | $94,556 |
Source: Public Records
Tax History Compared to Growth
Tax History
| Year | Tax Paid | Tax Assessment Tax Assessment Total Assessment is a certain percentage of the fair market value that is determined by local assessors to be the total taxable value of land and additions on the property. | Land | Improvement |
|---|---|---|---|---|
| 2025 | $1,413 | $15,108 | -- | -- |
| 2024 | $1,363 | $14,388 | -- | -- |
| 2023 | $1,363 | $31,680 | $6,330 | $25,350 |
| 2022 | $1,320 | $23,550 | $4,710 | $18,840 |
| 2021 | $1,357 | $21,800 | $4,360 | $17,440 |
| 2020 | $1,350 | $19,750 | $3,950 | $15,800 |
| 2019 | $1,302 | $17,880 | $3,570 | $14,310 |
| 2018 | $1,265 | $16,210 | $3,240 | $12,970 |
| 2017 | $1,189 | $14,920 | $2,980 | $11,940 |
| 2016 | $1,148 | $14,080 | $2,810 | $11,270 |
| 2015 | $1,101 | $12,610 | $2,520 | $10,090 |
Source: Public Records
Map
Nearby Homes
- 1367 N Los Altos Dr
- 1260 N Salida Del Sol
- 2221 W Rockwell Dr
- 2609 W Upland Dr
- 2571 W Park Ave
- 1080 N Blackstone Dr
- 2100 W Lemon Tree Place Unit 68
- 2100 W Lemon Tree Place Unit 29
- 2100 W Lemon Tree Place Unit 78
- 2663 W Estrella Dr
- 2580 W Shannon Ct
- 2455 W Shannon St
- 2875 W Highland St Unit 1102
- 2875 W Highland St Unit 1112
- 1719 N Cholla St
- 2431 W Los Arboles Place
- 1962 N Blackstone Dr
- 2702 W Brooks St
- 810 N Los Altos Dr
- 2623 W Ivanhoe St
- 2232 W Manor St
- 1412 N El Dorado Dr
- 2235 W Monroe St
- 2231 W Monroe St
- 1438 N El Dorado Dr
- 2228 W Manor St
- 1408 N El Dorado Dr Unit II
- 2239 W Manor St
- 2227 W Monroe St
- 1409 N Bullmoose Dr
- 1405 N Bullmoose Dr
- 1413 N Bullmoose Dr
- 2235 W Manor St
- 2224 W Manor St
- 1442 N El Dorado Dr Unit 2
- 2223 W Monroe St
- 1417 N Bullmoose Dr
- 1401 N Bullmoose Dr
- 2230 W Monroe St
- 1403 N El Dorado Dr