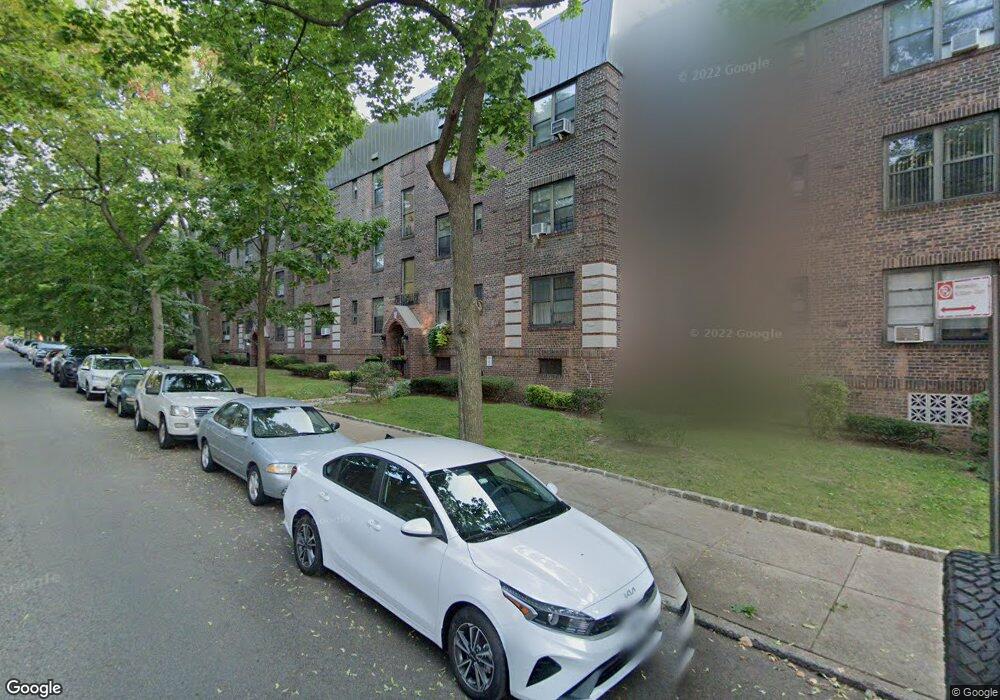
2237 77th St Unit A1 East Elmhurst, NY 11370
Ditmars Steinway NeighborhoodEstimated Value: $381,000 - $431,000
--
Bed
--
Bath
677
Sq Ft
$597/Sq Ft
Est. Value
About This Home
This home is located at 2237 77th St Unit A1, East Elmhurst, NY 11370 and is currently estimated at $404,498, approximately $597 per square foot. 2237 77th St Unit A1 is a home located in Queens County with nearby schools including P.S. 2 Alfred Zimberg, Is 141 The Steinway, and William Cullen Bryant High School.
Ownership History
Date
Name
Owned For
Owner Type
Purchase Details
Closed on
Sep 26, 2024
Sold by
Gao Qiuzhi
Bought by
Jiang Tao
Current Estimated Value
Purchase Details
Closed on
Apr 15, 2015
Sold by
Estate Of Joseph R Toretto and Gao
Bought by
Gao Qiuzhi
Purchase Details
Closed on
Apr 16, 2007
Sold by
Flecha Enrique and Flecha Isabel
Bought by
Toretto Joseph
Purchase Details
Closed on
Sep 17, 2001
Sold by
Lee Alexander
Bought by
Flecha Enrique and Flecha Isabel
Home Financials for this Owner
Home Financials are based on the most recent Mortgage that was taken out on this home.
Original Mortgage
$50,000
Interest Rate
6.86%
Purchase Details
Closed on
Dec 29, 1997
Sold by
Giunta Joseph
Bought by
Lee Alexander
Home Financials for this Owner
Home Financials are based on the most recent Mortgage that was taken out on this home.
Original Mortgage
$30,000
Interest Rate
7.11%
Create a Home Valuation Report for This Property
The Home Valuation Report is an in-depth analysis detailing your home's value as well as a comparison with similar homes in the area
Home Values in the Area
Average Home Value in this Area
Purchase History
| Date | Buyer | Sale Price | Title Company |
|---|---|---|---|
| Jiang Tao | -- | -- | |
| Gao Qiuzhi | -- | -- | |
| Gao Qiuzhi | -- | -- | |
| Toretto Joseph | $268,000 | -- | |
| Toretto Joseph | $268,000 | -- | |
| Flecha Enrique | -- | -- | |
| Flecha Enrique | -- | -- | |
| Lee Alexander | $68,000 | Chicago Title Insurance Co | |
| Lee Alexander | $68,000 | Chicago Title Insurance Co |
Source: Public Records
Mortgage History
| Date | Status | Borrower | Loan Amount |
|---|---|---|---|
| Previous Owner | Flecha Enrique | $50,000 | |
| Previous Owner | Lee Alexander | $30,000 |
Source: Public Records
Tax History Compared to Growth
Tax History
| Year | Tax Paid | Tax Assessment Tax Assessment Total Assessment is a certain percentage of the fair market value that is determined by local assessors to be the total taxable value of land and additions on the property. | Land | Improvement |
|---|---|---|---|---|
| 2025 | $1,528 | $24,662 | $5,661 | $19,001 |
| 2024 | $1,099 | $24,443 | $5,661 | $18,782 |
| 2023 | $1,537 | $24,586 | $5,661 | $18,925 |
| 2022 | $1,057 | $24,340 | $5,661 | $18,679 |
| 2021 | $984 | $22,302 | $5,661 | $16,641 |
| 2020 | $2,024 | $26,597 | $5,661 | $20,936 |
| 2019 | $1,906 | $26,597 | $5,661 | $20,936 |
| 2018 | $2,441 | $19,188 | $5,661 | $13,527 |
| 2017 | $2,306 | $18,128 | $5,661 | $12,467 |
| 2016 | $2,236 | $18,128 | $5,661 | $12,467 |
| 2015 | $1,354 | $16,718 | $5,661 | $11,057 |
| 2014 | $1,354 | $16,127 | $5,661 | $10,466 |
Source: Public Records
Map
Nearby Homes
- 22-31 77th St Unit C2
- 22-28 77th St Unit C1
- 2220 78th St Unit A3
- 22-39 78 St
- 2255 78th St Unit 2E
- 22-12 78th St Unit A2
- 22-27 76 St Unit B2
- 2209 76th St Unit C2
- 22-30 76th St Unit C2
- 76-12 Ditmars Blvd Unit B3
- 22-60 79th St Unit 1A
- 2208 76th St Unit A3
- 22-40 80th St Unit 2B
- 2230 75th St
- 21-40 78th St Unit 2
- 22-39 74th St
- 22-26 74th St
- 21-16 77 Street 2nd Floor
- 21-43 80th St
- 21-14 80th St
- 2237 77th St Unit C3
- 2237 77th St Unit B3
- 2237 77th St Unit A3
- 2237 77th St Unit C2
- 2237 77th St Unit B2
- 2237 77th St Unit A2
- 2237 77th St Unit C1
- 2237 77th St Unit B1
- 2237 77th St
- 2231 77th St Unit A 2
- 2231 77th St Unit C1
- 2231 77th St Unit C3
- 2231 77th St Unit B3
- 2231 77th St Unit A3
- 2231 77th St Unit C2
- 2231 77th St Unit B2
- 2231 77th St Unit A2
- 2231 77th St Unit A1
- 22-31 77th St Unit A3
- 22-31 77th St