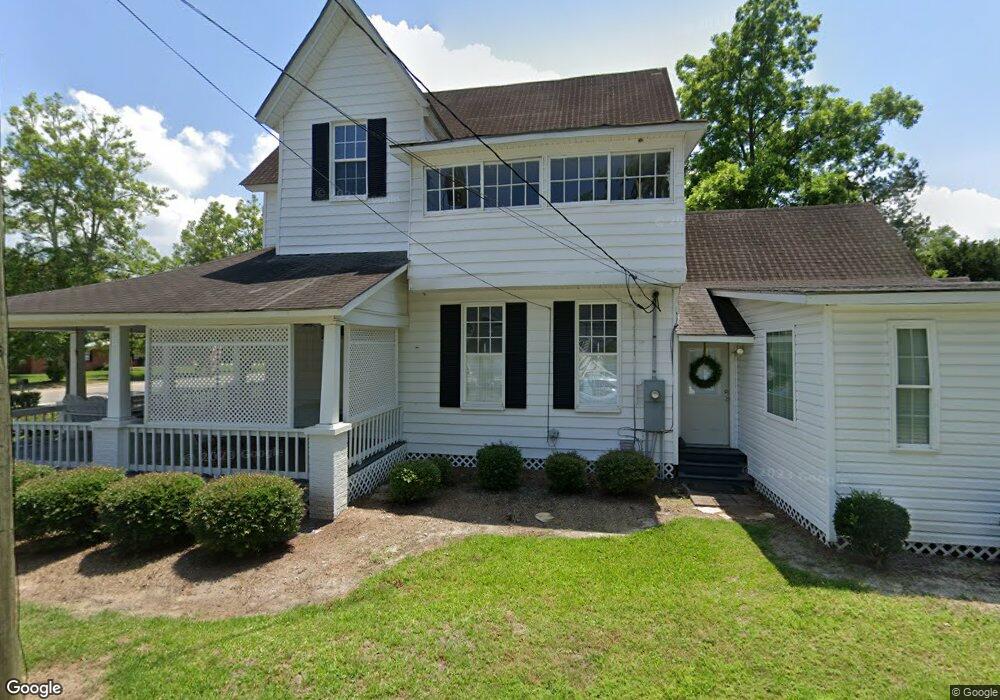
22373 Main St Alapaha, GA 31622
Estimated Value: $138,000 - $233,000
--
Bed
--
Bath
2,547
Sq Ft
$69/Sq Ft
Est. Value
About This Home
This home is located at 22373 Main St, Alapaha, GA 31622 and is currently estimated at $175,377, approximately $68 per square foot. 22373 Main St is a home with nearby schools including Berrien Primary School, Berrien Elementary School, and Berrien Middle School.
Ownership History
Date
Name
Owned For
Owner Type
Purchase Details
Closed on
Jun 11, 1996
Bought by
Partin John M
Current Estimated Value
Create a Home Valuation Report for This Property
The Home Valuation Report is an in-depth analysis detailing your home's value as well as a comparison with similar homes in the area
Home Values in the Area
Average Home Value in this Area
Purchase History
| Date | Buyer | Sale Price | Title Company |
|---|---|---|---|
| Partin John M | -- | -- |
Source: Public Records
Tax History Compared to Growth
Tax History
| Year | Tax Paid | Tax Assessment Tax Assessment Total Assessment is a certain percentage of the fair market value that is determined by local assessors to be the total taxable value of land and additions on the property. | Land | Improvement |
|---|---|---|---|---|
| 2024 | $1,471 | $36,072 | $1,460 | $34,612 |
| 2023 | $1,477 | $36,072 | $1,460 | $34,612 |
| 2022 | $1,477 | $36,072 | $1,460 | $34,612 |
| 2021 | $1,454 | $36,072 | $1,460 | $34,612 |
| 2020 | $1,454 | $36,072 | $1,460 | $34,612 |
| 2019 | $1,454 | $36,072 | $1,460 | $34,612 |
| 2018 | $1,454 | $36,072 | $1,460 | $34,612 |
| 2017 | $1,454 | $36,072 | $1,460 | $34,612 |
| 2016 | -- | $36,072 | $1,460 | $34,612 |
| 2015 | -- | $36,071 | $1,460 | $34,612 |
| 2014 | -- | $28,511 | $1,460 | $27,052 |
| 2013 | -- | $27,852 | $800 | $27,052 |
Source: Public Records
Map
Nearby Homes
- 525 Church St
- 21803 Main St
- . Alapaha River Dr
- 0 Quail Ln
- 49 Quail Ln
- 2264 Spurlock Rd
- 1508 Lawton McMillan Rd
- 0 Nashville Enigma Rd
- 2242 U S 82
- 395 Harris St
- 2000 Coochee Creek Rd
- 1922 Turner Church Rd
- 2750 Ten Mile Bay Rd
- 0 June Hendley Rd
- 287 Brookfield Nashville Rd
- 339 Chapel Hill Cir Unit 15
- 339 Chapel Hill Cir
- 3343 N Coffee Rd
- 2421 Nashville Enigma Rd
- 564 Barney Parker Rd