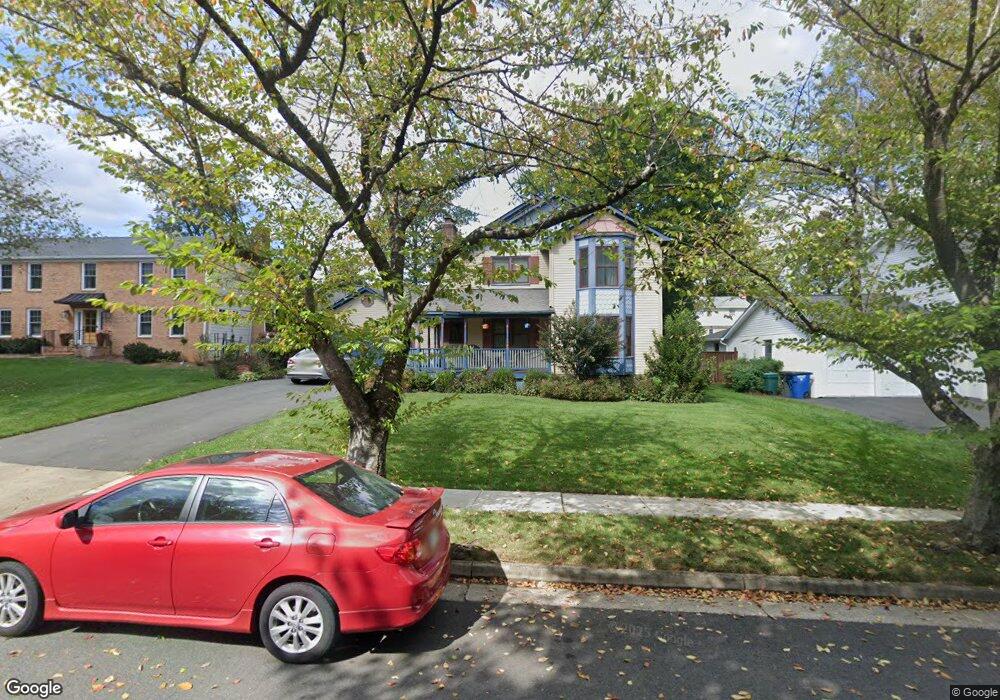
2238 Casemont Dr Falls Church, VA 22046
Estimated Value: $1,325,000 - $1,472,000
3
Beds
4
Baths
2,184
Sq Ft
$631/Sq Ft
Est. Value
About This Home
This home is located at 2238 Casemont Dr, Falls Church, VA 22046 and is currently estimated at $1,377,282, approximately $630 per square foot. 2238 Casemont Dr is a home located in Fairfax County with nearby schools including Haycock Elementary School, Longfellow Middle School, and St. James Catholic School.
Ownership History
Date
Name
Owned For
Owner Type
Purchase Details
Closed on
Feb 25, 1998
Sold by
Fox Shirley M and Fox Donald C
Bought by
Cashin Paul A and Cashin Jane L
Current Estimated Value
Home Financials for this Owner
Home Financials are based on the most recent Mortgage that was taken out on this home.
Original Mortgage
$180,000
Outstanding Balance
$32,435
Interest Rate
6.85%
Mortgage Type
New Conventional
Estimated Equity
$1,344,847
Purchase Details
Closed on
Apr 5, 1994
Sold by
Welner Stephen S
Bought by
Fox Shirley M
Home Financials for this Owner
Home Financials are based on the most recent Mortgage that was taken out on this home.
Original Mortgage
$328,500
Interest Rate
7.07%
Create a Home Valuation Report for This Property
The Home Valuation Report is an in-depth analysis detailing your home's value as well as a comparison with similar homes in the area
Home Values in the Area
Average Home Value in this Area
Purchase History
| Date | Buyer | Sale Price | Title Company |
|---|---|---|---|
| Cashin Paul A | $367,000 | -- | |
| Fox Shirley M | $365,000 | -- |
Source: Public Records
Mortgage History
| Date | Status | Borrower | Loan Amount |
|---|---|---|---|
| Open | Fox Shirley M | $180,000 | |
| Previous Owner | Fox Shirley M | $328,500 |
Source: Public Records
Tax History Compared to Growth
Tax History
| Year | Tax Paid | Tax Assessment Tax Assessment Total Assessment is a certain percentage of the fair market value that is determined by local assessors to be the total taxable value of land and additions on the property. | Land | Improvement |
|---|---|---|---|---|
| 2025 | $14,138 | $1,350,820 | $594,000 | $756,820 |
| 2024 | $14,138 | $1,196,630 | $489,000 | $707,630 |
| 2023 | $12,905 | $1,120,730 | $434,000 | $686,730 |
| 2022 | $11,660 | $999,580 | $434,000 | $565,580 |
| 2021 | $11,457 | $957,580 | $392,000 | $565,580 |
| 2020 | $11,457 | $949,580 | $384,000 | $565,580 |
| 2019 | $10,471 | $867,880 | $349,000 | $518,880 |
| 2018 | $9,341 | $812,290 | $349,000 | $463,290 |
| 2017 | $9,474 | $800,210 | $346,000 | $454,210 |
| 2016 | $9,737 | $824,120 | $346,000 | $478,120 |
| 2015 | $8,881 | $779,730 | $320,000 | $459,730 |
| 2014 | $7,966 | $700,940 | $283,000 | $417,940 |
Source: Public Records
Map
Nearby Homes
- 6712 Moly Dr
- 6707 Hallwood Ave
- 6703 Hallwood Ave
- 6616 Fisher Ave
- 6613 Fisher Ave
- 2300 Meridian St
- 2221 Orchid Dr
- 2202 Grayson Place
- 2240 Highland Terrace
- 6927 Haycock Rd
- 6601 Gordon Ave
- 2302 Westmoreland St
- 6940 Spruce St
- 2118 Greenwich St
- 6990 Falls Reach Dr Unit 313
- 6545 Placid St
- 6610 Quinten St
- 6616 Kirby Ct
- 6956 Birch St
- 6609 Rockmont Ct
- 2236 Casemont Dr
- 2240 Casemont Dr
- 6713 Moly Dr
- 6711 Moly Dr
- 6715 Moly Dr
- 2234 Casemont Dr
- 2237 Casemont Dr
- 2223 Great Falls St
- 2242 Casemont Dr
- 6709 Moly Dr
- 2235 Casemont Dr
- 2221 Great Falls St
- 2243 Casemont Dr
- 2241 Casemont Dr
- 2232 Casemont Dr
- 6707 Moly Dr
- 2233 Casemont Dr
- 6712 Osborn St
- 6710 Osborn St
- 6714 Osborn St