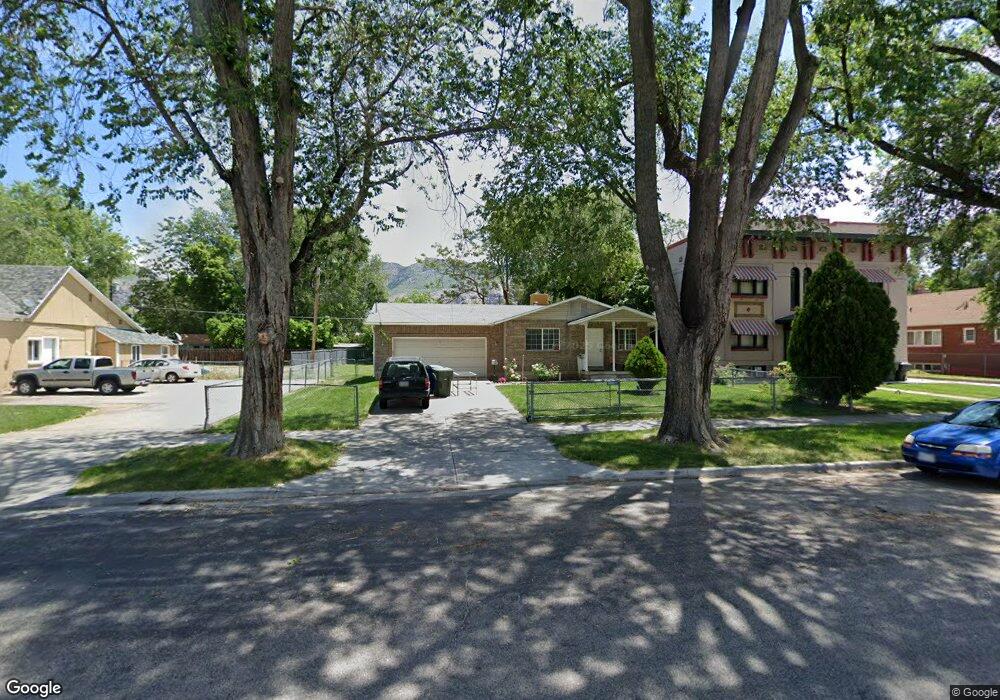
2238 Jefferson Ave Ogden, UT 84401
East Central Ogden NeighborhoodEstimated Value: $350,000 - $415,206
3
Beds
1
Bath
2,100
Sq Ft
$177/Sq Ft
Est. Value
About This Home
This home is located at 2238 Jefferson Ave, Ogden, UT 84401 and is currently estimated at $370,802, approximately $176 per square foot. 2238 Jefferson Ave is a home located in Weber County with nearby schools including New Bridge School, Mound Fort Junior High School, and Ogden High School.
Ownership History
Date
Name
Owned For
Owner Type
Purchase Details
Closed on
Mar 5, 2008
Sold by
Gonzalez Rufino and Pineda Martha
Bought by
Gonzalez Rufino and Pineda Martha
Current Estimated Value
Home Financials for this Owner
Home Financials are based on the most recent Mortgage that was taken out on this home.
Original Mortgage
$136,000
Interest Rate
4.85%
Mortgage Type
New Conventional
Purchase Details
Closed on
Dec 28, 1998
Sold by
Hernandez Felipe and Hernandez Maria G
Bought by
Gonzalez Rufino and Pineda Martha
Home Financials for this Owner
Home Financials are based on the most recent Mortgage that was taken out on this home.
Original Mortgage
$97,850
Interest Rate
6.91%
Mortgage Type
FHA
Purchase Details
Closed on
May 13, 1996
Sold by
Ogden City Redevelopment Agency
Bought by
Hernandez Felipe and Hernandez Maria G
Home Financials for this Owner
Home Financials are based on the most recent Mortgage that was taken out on this home.
Original Mortgage
$52,500
Interest Rate
8.15%
Create a Home Valuation Report for This Property
The Home Valuation Report is an in-depth analysis detailing your home's value as well as a comparison with similar homes in the area
Home Values in the Area
Average Home Value in this Area
Purchase History
| Date | Buyer | Sale Price | Title Company |
|---|---|---|---|
| Gonzalez Rufino | -- | Lincoln Title Ins Agency | |
| Gonzalez Rufino | -- | Bonneville Title Company | |
| Hernandez Felipe | -- | -- |
Source: Public Records
Mortgage History
| Date | Status | Borrower | Loan Amount |
|---|---|---|---|
| Closed | Gonzalez Rufino | $136,000 | |
| Closed | Gonzalez Rufino | $97,850 | |
| Previous Owner | Hernandez Felipe | $52,500 | |
| Closed | Hernandez Felipe | $10,000 |
Source: Public Records
Tax History Compared to Growth
Tax History
| Year | Tax Paid | Tax Assessment Tax Assessment Total Assessment is a certain percentage of the fair market value that is determined by local assessors to be the total taxable value of land and additions on the property. | Land | Improvement |
|---|---|---|---|---|
| 2025 | $2,646 | $387,971 | $112,707 | $275,264 |
| 2024 | $2,723 | $215,599 | $61,988 | $153,611 |
| 2023 | $2,616 | $208,450 | $53,858 | $154,592 |
| 2022 | $2,905 | $232,100 | $51,049 | $181,051 |
| 2021 | $2,195 | $291,000 | $52,153 | $238,847 |
| 2020 | $1,910 | $234,000 | $40,859 | $193,141 |
| 2019 | $1,800 | $207,000 | $35,718 | $171,282 |
| 2018 | $1,549 | $177,000 | $31,001 | $145,999 |
| 2017 | $1,377 | $147,000 | $38,800 | $108,200 |
| 2016 | $1,365 | $78,762 | $12,815 | $65,947 |
| 2015 | $1,036 | $58,342 | $12,815 | $45,527 |
| 2014 | $1,017 | $56,232 | $11,450 | $44,782 |
Source: Public Records
Map
Nearby Homes
- 2248 Jefferson Ave
- 2226 Jefferson Ave
- 2249 Wade Ct
- 2254 Jefferson Ave
- 2254 Jefferson Ave Unit 1
- 2257 Wade Ct
- 2220 Jefferson Ave
- 619 E 22nd St
- 619 E 22nd St
- 619 E 22nd St Unit REAR
- 2245 Jefferson Ave
- 2262 Jefferson Ave
- 2263 Wade Ct
- 2210 Jefferson Ave
- 629 E 22nd St
- 2268 Jefferson Ave
- 2268 Jefferson Ave
- 2239 Jefferson Ave
- 2233 Jefferson Ave
- 2227 Jefferson Ave