Estimated Value: $441,000 - $475,000
3
Beds
2
Baths
1,202
Sq Ft
$380/Sq Ft
Est. Value
About This Home
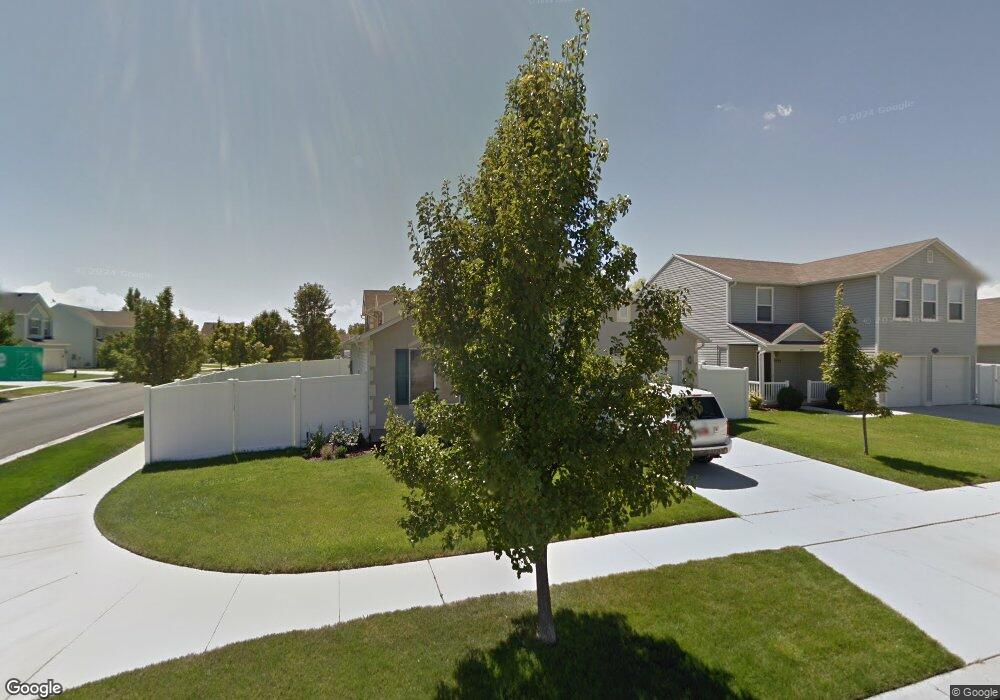
This home is located at 2238 Lennox Ln, Lehi, UT 84043 and is currently estimated at $457,092, approximately $380 per square foot. 2238 Lennox Ln is a home located in Utah County with nearby schools including Dry Creek Elementary School, Lehi Junior High School, and Lehi High School.
Ownership History
Date
Name
Owned For
Owner Type
Purchase Details
Closed on
Nov 16, 2021
Sold by
Ator Zach
Bought by
Ator Zach
Current Estimated Value
Home Financials for this Owner
Home Financials are based on the most recent Mortgage that was taken out on this home.
Original Mortgage
$207,150
Outstanding Balance
$189,817
Interest Rate
2.99%
Mortgage Type
New Conventional
Estimated Equity
$267,275
Purchase Details
Closed on
Dec 28, 2017
Sold by
Spephensen Alisha D
Bought by
Brown Riley B and Dunford Mikayla L
Home Financials for this Owner
Home Financials are based on the most recent Mortgage that was taken out on this home.
Original Mortgage
$234,671
Interest Rate
4.12%
Mortgage Type
FHA
Purchase Details
Closed on
May 19, 2009
Sold by
Miller Dustin J and Miller Tiffany L
Bought by
Stephensen Alisha D
Home Financials for this Owner
Home Financials are based on the most recent Mortgage that was taken out on this home.
Original Mortgage
$178,500
Interest Rate
4.78%
Mortgage Type
Purchase Money Mortgage
Create a Home Valuation Report for This Property
The Home Valuation Report is an in-depth analysis detailing your home's value as well as a comparison with similar homes in the area
Home Values in the Area
Average Home Value in this Area
Purchase History
| Date | Buyer | Sale Price | Title Company |
|---|---|---|---|
| Ator Zach | -- | Meridian Title | |
| Brown Riley B | -- | Meridian Title Co | |
| Stephensen Alisha D | -- | Empire Land Title Inc |
Source: Public Records
Mortgage History
| Date | Status | Borrower | Loan Amount |
|---|---|---|---|
| Open | Ator Zach | $207,150 | |
| Previous Owner | Brown Riley B | $234,671 | |
| Previous Owner | Stephensen Alisha D | $178,500 |
Source: Public Records
Tax History Compared to Growth
Tax History
| Year | Tax Paid | Tax Assessment Tax Assessment Total Assessment is a certain percentage of the fair market value that is determined by local assessors to be the total taxable value of land and additions on the property. | Land | Improvement |
|---|---|---|---|---|
| 2025 | $1,764 | $225,885 | $168,800 | $241,900 |
| 2024 | $1,764 | $211,585 | $0 | $0 |
| 2023 | $1,657 | $213,730 | $0 | $0 |
| 2022 | $1,695 | $213,235 | $0 | $0 |
| 2021 | $1,525 | $286,300 | $97,700 | $188,600 |
| 2020 | $1,447 | $266,800 | $90,500 | $176,300 |
| 2019 | $1,277 | $243,800 | $90,500 | $153,300 |
| 2018 | $1,227 | $221,100 | $86,000 | $135,100 |
| 2017 | $1,093 | $105,325 | $0 | $0 |
| 2016 | $1,100 | $98,340 | $0 | $0 |
| 2015 | $1,118 | $94,820 | $0 | $0 |
| 2014 | $1,045 | $87,670 | $0 | $0 |
Source: Public Records
Map
Nearby Homes
- 77 N Richmond Ln
- 72 N Montrose Ln
- 178 N Husker Ln Unit 2
- Willow Plan at Freedom View Cove
- Oak Plan at Freedom View Cove
- 218 N Husker Ln
- 193 N Husker Ln
- 242 N Husker Ln Unit 8
- Adagio Plan at Grandeur Estates
- Ballad Plan at Grandeur Estates
- Interlude Plan at Grandeur Estates
- Trio Plan at Grandeur Estates
- Forte Plan at Grandeur Estates
- Tenor Plan at Grandeur Estates
- Staccato Plan at Grandeur Estates
- Prelude Plan at Grandeur Estates
- Octave Plan at Grandeur Estates
- Finale Plan at Grandeur Estates
- Harrison Plan at Grandeur Estates
- Crescendo Plan at Grandeur Estates
- 2224 Lennox Ln
- 2233 Lennox Ln
- 2239 Lennox Ln
- 2227 Lennox Ln
- 2227 E Lennox Ln
- 2232 E Lennox Ln
- 2224 E Lennox Ln
- 2238 E Lennox Ln
- 2219 E Lennox Ln
- 2249 E Lennox Ln
- 2219 Lennox Ln
- 66 Richmond Ln
- 2216 E Lennox Ln
- 2234 Hawthorne St
- 2234 E Hawthorne St
- 2211 E Lennox Ln
- 2226 E Hawthorne St
- 2242 Hawthorne St
- 66 N Richmond Ln
- 2226 E Hawthorne St