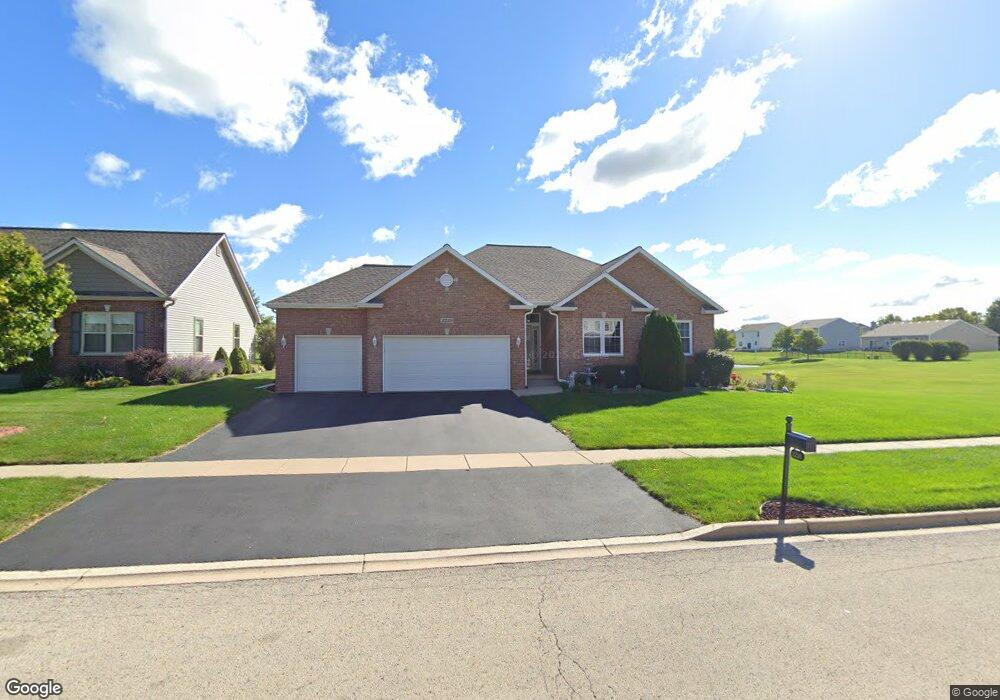
2238 Luther Lowell Ln Sycamore, IL 60178
Estimated Value: $396,586 - $441,000
4
Beds
2
Baths
1,732
Sq Ft
$241/Sq Ft
Est. Value
About This Home
This home is located at 2238 Luther Lowell Ln, Sycamore, IL 60178 and is currently estimated at $417,147, approximately $240 per square foot. 2238 Luther Lowell Ln is a home located in DeKalb County with nearby schools including Sycamore High School, St Mary's Catholic School, and Cornerstone Christian Academy.
Ownership History
Date
Name
Owned For
Owner Type
Purchase Details
Closed on
Dec 4, 2010
Sold by
Nowak Donald R
Bought by
Nowak Donald R
Current Estimated Value
Home Financials for this Owner
Home Financials are based on the most recent Mortgage that was taken out on this home.
Original Mortgage
$100,000
Outstanding Balance
$66,102
Interest Rate
4.23%
Mortgage Type
New Conventional
Estimated Equity
$351,045
Purchase Details
Closed on
Dec 3, 2010
Sold by
Nowak Donald R
Bought by
Nowak Donald R and Nowak Barbara
Home Financials for this Owner
Home Financials are based on the most recent Mortgage that was taken out on this home.
Original Mortgage
$100,000
Outstanding Balance
$66,102
Interest Rate
4.23%
Mortgage Type
New Conventional
Estimated Equity
$351,045
Purchase Details
Closed on
Mar 3, 2010
Sold by
Nowak Donald R
Bought by
Nowak Trust
Purchase Details
Closed on
Sep 14, 2006
Sold by
Siuda Kevin
Bought by
Nowak Donald R and Nowak Barbara
Home Financials for this Owner
Home Financials are based on the most recent Mortgage that was taken out on this home.
Original Mortgage
$65,000
Interest Rate
6.59%
Mortgage Type
New Conventional
Create a Home Valuation Report for This Property
The Home Valuation Report is an in-depth analysis detailing your home's value as well as a comparison with similar homes in the area
Home Values in the Area
Average Home Value in this Area
Purchase History
| Date | Buyer | Sale Price | Title Company |
|---|---|---|---|
| Nowak Donald R | -- | -- | |
| Nowak Donald R | -- | -- | |
| Nowak Trust | -- | -- | |
| Nowak Donald R | $318,000 | -- |
Source: Public Records
Mortgage History
| Date | Status | Borrower | Loan Amount |
|---|---|---|---|
| Open | Nowak Donald R | $100,000 | |
| Previous Owner | Nowak Donald R | $65,000 |
Source: Public Records
Tax History Compared to Growth
Tax History
| Year | Tax Paid | Tax Assessment Tax Assessment Total Assessment is a certain percentage of the fair market value that is determined by local assessors to be the total taxable value of land and additions on the property. | Land | Improvement |
|---|---|---|---|---|
| 2024 | $5,718 | $123,206 | $14,641 | $108,565 |
| 2023 | $5,718 | $97,006 | $11,528 | $85,478 |
| 2022 | $5,991 | $88,972 | $10,573 | $78,399 |
| 2021 | $6,099 | $83,526 | $9,926 | $73,600 |
| 2020 | $6,176 | $81,473 | $9,682 | $71,791 |
| 2019 | $6,222 | $79,688 | $9,470 | $70,218 |
| 2018 | $6,321 | $77,270 | $9,183 | $68,087 |
| 2017 | $6,439 | $74,213 | $8,820 | $65,393 |
| 2016 | $6,805 | $76,101 | $19,625 | $56,476 |
| 2015 | -- | $71,625 | $18,471 | $53,154 |
| 2014 | -- | $68,014 | $17,540 | $50,474 |
| 2013 | -- | $69,317 | $17,876 | $51,441 |
Source: Public Records
Map
Nearby Homes
- Cypress Plan at North Grove Crossings
- Hawthorn Plan at North Grove Crossings
- 513 Amherst Dr
- 326 Davis Dr
- 318 Davis Dr
- 224 Whittemore Dr
- 218 Whittemore Dr
- 209 Whittemore Dr
- 233 Whittemore Dr
- 2310 Dean St
- 2320 Coventry Cir S
- 401 John Marshall Ln
- 169 Plank Rd
- 2 Bedroom/Sunroom Plan at Camden Crossing
- 2 Bedroom Plan at Camden Crossing
- 1 Bedroom Plan at Camden Crossing
- 223 Merry Oaks Dr
- 2203 Wickford Ln
- Lot 86 Merry Oaks Dr
- Lot 97 Merry Oaks Dr
- 2246 Luther Lowell Ln
- 2239 Luther Lowell Ln
- 2254 Luther Lowell Ln
- 2247 Luther Lowell Ln
- 2231 Luther Lowell Ln
- 2223 Luther Lowell Ln
- 503 Alden Dr
- Lot197 Alden Dr
- 510 Alden Dr
- 511 Alden Dr
- 518 Alden Dr
- 519 Alden Dr
- 528 Northgate Dr
- 526 Alden Dr
- 520 Northgate Dr
- 527 Alden Dr
- 512 Northgate Dr
- 1 Alden Dr
- Lot Alden Dr
- Lot #197 Alden Dr