Estimated Value: $190,000 - $214,000
3
Beds
1
Bath
1,376
Sq Ft
$148/Sq Ft
Est. Value
About This Home
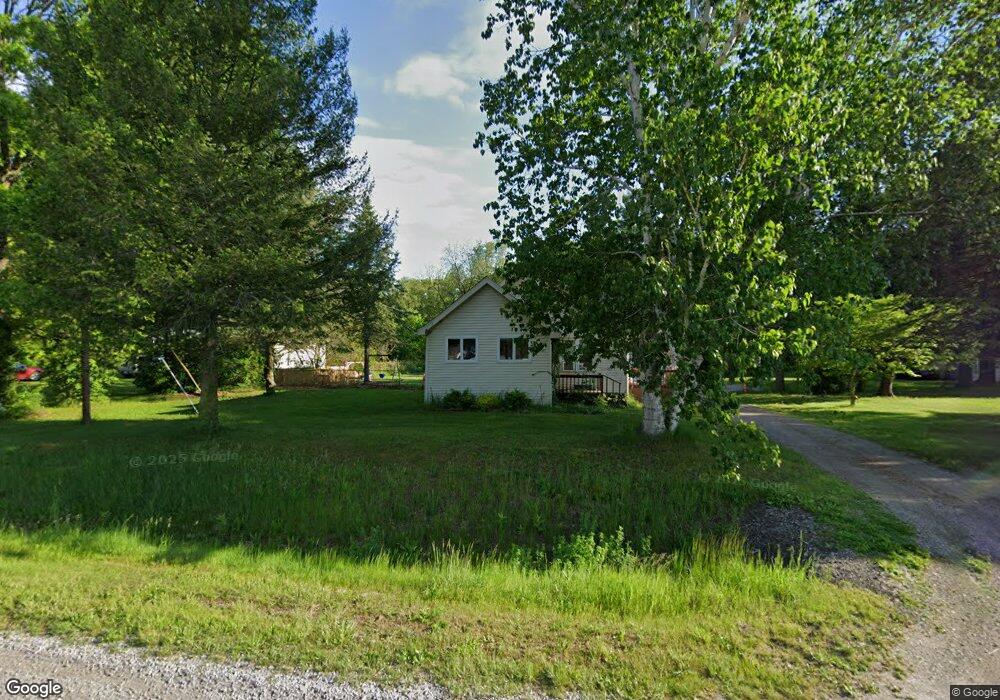
This home is located at 2238 W Dodge Rd Unit Bldg-Unit, Clio, MI 48420 and is currently estimated at $203,410, approximately $147 per square foot. 2238 W Dodge Rd Unit Bldg-Unit is a home located in Genesee County with nearby schools including Elisabeth Ann Johnson High School and St. Mary's School.
Ownership History
Date
Name
Owned For
Owner Type
Purchase Details
Closed on
Sep 18, 2020
Sold by
Colburn Kerby and Oneil Kerby
Bought by
Somers Bryce A and Somers Sabrina M
Current Estimated Value
Purchase Details
Closed on
Jul 16, 2018
Sold by
Deloney Zachary T and Deloney Anastasia
Bought by
Oneil Kerby
Home Financials for this Owner
Home Financials are based on the most recent Mortgage that was taken out on this home.
Original Mortgage
$117,727
Interest Rate
5.5%
Mortgage Type
FHA
Purchase Details
Closed on
Aug 12, 2015
Sold by
Shelley George R and Shelley Bobbie
Bought by
Deloney Zachary T
Home Financials for this Owner
Home Financials are based on the most recent Mortgage that was taken out on this home.
Original Mortgage
$91,734
Interest Rate
4.04%
Mortgage Type
New Conventional
Purchase Details
Closed on
Jun 9, 2000
Sold by
Hoeflinger William H and Hoeflinger Naomi B
Bought by
Shelley George R
Create a Home Valuation Report for This Property
The Home Valuation Report is an in-depth analysis detailing your home's value as well as a comparison with similar homes in the area
Home Values in the Area
Average Home Value in this Area
Purchase History
| Date | Buyer | Sale Price | Title Company |
|---|---|---|---|
| Somers Bryce A | $155,000 | None Available | |
| Oneil Kerby | $119,900 | None Available | |
| Deloney Zachary T | $89,900 | First American Title Ins Co | |
| Shelley George R | $103,000 | Sargents Title Company |
Source: Public Records
Mortgage History
| Date | Status | Borrower | Loan Amount |
|---|---|---|---|
| Previous Owner | Oneil Kerby | $117,727 | |
| Previous Owner | Deloney Zachary T | $91,734 |
Source: Public Records
Tax History Compared to Growth
Tax History
| Year | Tax Paid | Tax Assessment Tax Assessment Total Assessment is a certain percentage of the fair market value that is determined by local assessors to be the total taxable value of land and additions on the property. | Land | Improvement |
|---|---|---|---|---|
| 2025 | $1,992 | $80,800 | $0 | $0 |
| 2024 | $615 | $76,400 | $0 | $0 |
| 2023 | $587 | $65,300 | $0 | $0 |
| 2022 | $1,819 | $57,700 | $0 | $0 |
| 2021 | $1,802 | $47,000 | $0 | $0 |
| 2020 | $491 | $44,000 | $0 | $0 |
| 2019 | $483 | $41,600 | $0 | $0 |
| 2018 | $1,404 | $42,200 | $0 | $0 |
| 2017 | $1,341 | $42,200 | $0 | $0 |
| 2016 | $1,330 | $39,100 | $0 | $0 |
| 2015 | $1,326 | $39,900 | $0 | $0 |
| 2012 | -- | $38,500 | $38,500 | $0 |
Source: Public Records
Map
Nearby Homes
- 2342 Meadowbrook Ln
- 2461 Meadowbrook Ln
- 2411 Bingham Rd
- 3056 Wilman Dr
- 2076 Aspen Ln S
- 11063 Aspen Ln S
- 2078 Aspen Ln S
- 9083 N Clio Rd
- 2065 Cedar Cir
- 11032 Kasteel Ct
- 3289 W Dodge Rd
- 2067 Spruce Way
- 2069 Hickory Ln
- 1515 W Frances Rd
- 11065 Hickory Ln
- 10388 Rene Dr
- 1340 W Wilson Rd
- 10381 Rene Dr
- 0 Rene Dr
- 11102 Pheasant Run Dr
- 2238 W Dodge Rd
- 2250 W Dodge Rd
- 2222 W Dodge Rd
- 2214 W Dodge Rd
- 2184 W Dodge Rd
- 2282 W Dodge Rd
- 2172 W Dodge Rd
- 2136 W Dodge Rd
- 2231 W Dodge Rd
- 2221 W Dodge Rd
- 2207 W Dodge Rd
- 2263 W Dodge Rd
- 2126 W Dodge Rd
- 2189 W Dodge Rd
- 2249 W Dodge Rd
- 2157 W Dodge Rd
- 2323 Meadowbrook Ln
- 2283 W Dodge Rd
- 2102 W Dodge Rd
- 2137 W Dodge Rd