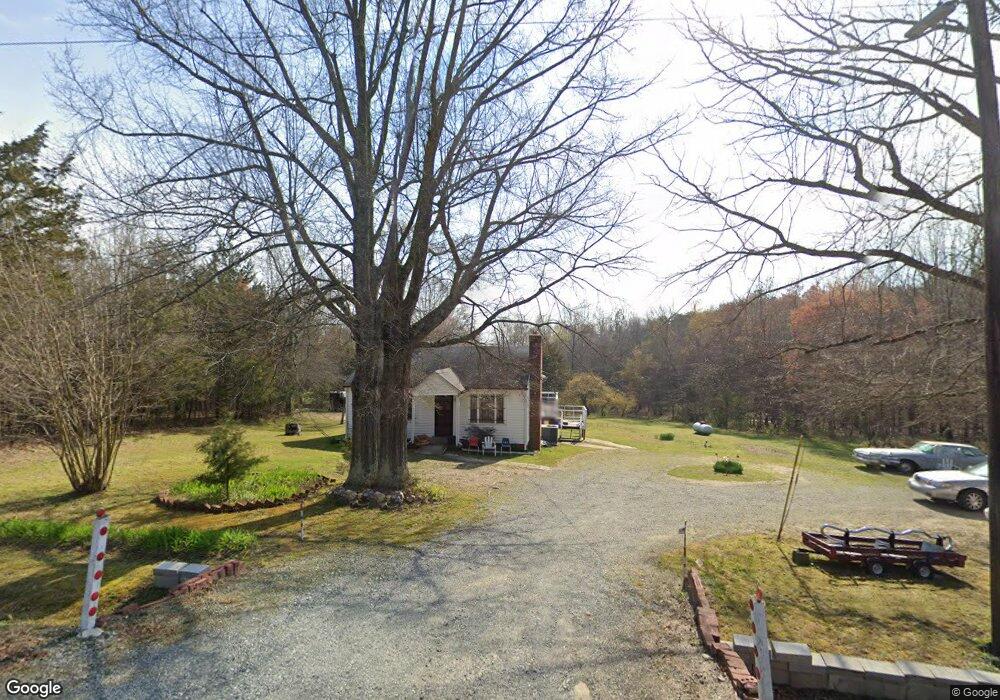
2239 Johnson Rd Burlington, NC 27217
Estimated Value: $168,555 - $216,000
2
Beds
1
Bath
980
Sq Ft
$190/Sq Ft
Est. Value
About This Home
This home is located at 2239 Johnson Rd, Burlington, NC 27217 and is currently estimated at $186,389, approximately $190 per square foot. 2239 Johnson Rd is a home located in Alamance County with nearby schools including E.M. Yoder Elementary School, Woodlawn Middle School, and Eastern Alamance High School.
Ownership History
Date
Name
Owned For
Owner Type
Purchase Details
Closed on
Aug 13, 2018
Sold by
Snipes Susie J and Walters Belinda S
Bought by
Snipes Susie J and Snipes St Clair
Current Estimated Value
Purchase Details
Closed on
Jan 1, 1990
Bought by
Harrelson Susie
Create a Home Valuation Report for This Property
The Home Valuation Report is an in-depth analysis detailing your home's value as well as a comparison with similar homes in the area
Home Values in the Area
Average Home Value in this Area
Purchase History
| Date | Buyer | Sale Price | Title Company |
|---|---|---|---|
| Snipes Susie J | -- | None Available | |
| Harrelson Susie | -- | -- |
Source: Public Records
Tax History Compared to Growth
Tax History
| Year | Tax Paid | Tax Assessment Tax Assessment Total Assessment is a certain percentage of the fair market value that is determined by local assessors to be the total taxable value of land and additions on the property. | Land | Improvement |
|---|---|---|---|---|
| 2025 | $641 | $107,949 | $42,921 | $65,028 |
| 2024 | $596 | $107,949 | $42,921 | $65,028 |
| 2023 | $553 | $107,949 | $42,921 | $65,028 |
| 2022 | $560 | $73,060 | $33,753 | $39,307 |
| 2021 | $552 | $73,060 | $33,753 | $39,307 |
| 2020 | $560 | $73,060 | $33,753 | $39,307 |
| 2019 | $563 | $73,060 | $33,753 | $39,307 |
| 2018 | $0 | $73,060 | $33,753 | $39,307 |
| 2017 | $424 | $62,716 | $33,753 | $28,963 |
| 2016 | $453 | $66,592 | $31,428 | $35,164 |
| 2015 | $437 | $66,592 | $31,428 | $35,164 |
| 2014 | -- | $66,592 | $31,428 | $35,164 |
Source: Public Records
Map
Nearby Homes
- 0 Haith Fuller Trail
- 00 Haith Fuller Trail
- 3082 Cascade Dr
- 134 Pillow Ln
- 2513 William Allen Rd
- 2619 William Allen Rd
- 219 Pillow Ln
- 2634 William Allen Rd
- 2200 State Highway 49
- 119 Gideon Place
- 1862 Miles Chapel Rd
- 1853 Miles Chapel Rd
- 191 Steamboat Ln
- 2819 John Lewis Rd
- 2848 John Lewis Rd
- 2830 Barnett Rd
- Lot 14 Crumpton Trail
- Lot 15 Crumpton Trail
- 2223 Johnson Rd
- 2168 Johnson Rd
- 3003 Dickey Mill Rd
- 0 King Headen Trail
- 2141 Johnson Rd
- 2021 Johnson Rd
- 3020 Dickey Mill Rd
- 2071 King Headen Trail
- 3227 Dickey Mill Rd
- 2028 Johnson Rd
- 0 Dickey Mill Rd
- 0 Dickey Mill Rd
- 2871 Dickey Mill Rd
- 3266 Dickey Mill Rd
- 2094 Haith Fuller Trail
- 2084 Haith Fuller Trail
- 2072 Haith Fuller Trail
- 2077 Haith Fuller Trail
- 000 Haith Fuller Trail
- 1951 Johnson Rd