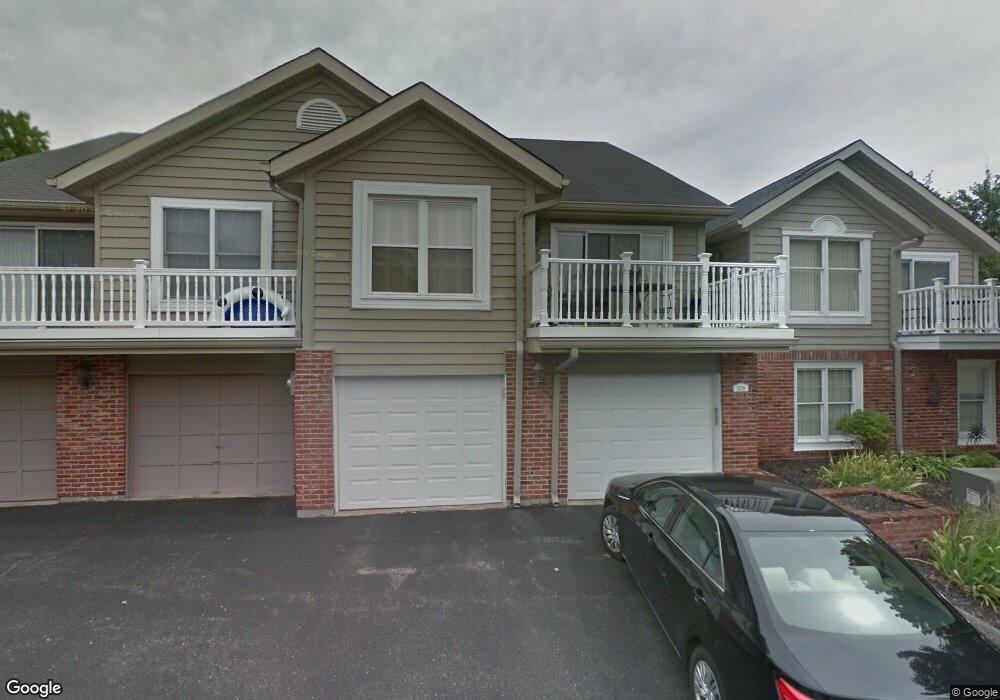
2239 Ole Castle Ct Chesterfield, MO 63017
Estimated Value: $240,161 - $334,000
2
Beds
2
Baths
1,306
Sq Ft
$209/Sq Ft
Est. Value
About This Home
This home is located at 2239 Ole Castle Ct, Chesterfield, MO 63017 and is currently estimated at $273,290, approximately $209 per square foot. 2239 Ole Castle Ct is a home located in St. Louis County with nearby schools including Henry Elementary School, Parkway West Middle School, and Parkway West High School.
Ownership History
Date
Name
Owned For
Owner Type
Purchase Details
Closed on
Aug 14, 2020
Sold by
Gannon Clifford W and Clifford W Gannon Trust
Bought by
Gannon Richard W
Current Estimated Value
Home Financials for this Owner
Home Financials are based on the most recent Mortgage that was taken out on this home.
Original Mortgage
$177,361
Outstanding Balance
$157,332
Interest Rate
3%
Mortgage Type
New Conventional
Estimated Equity
$115,958
Purchase Details
Closed on
Nov 7, 2012
Sold by
Emerson Alan
Bought by
Clifford W Gannon Revocable Living Trust
Purchase Details
Closed on
Mar 6, 2000
Sold by
Mueller Paul M and Mueller Sage R
Bought by
Emerson Alan
Purchase Details
Closed on
Nov 9, 1998
Sold by
Union Planters Bank Na
Bought by
Mueller Paul M and Mueller Sage R
Purchase Details
Closed on
Oct 13, 1997
Sold by
Feinstein Martin and Feinstein Sue
Bought by
Margaret C Ulm Hillmer Revocable Living and Magna Bank Na
Create a Home Valuation Report for This Property
The Home Valuation Report is an in-depth analysis detailing your home's value as well as a comparison with similar homes in the area
Home Values in the Area
Average Home Value in this Area
Purchase History
| Date | Buyer | Sale Price | Title Company |
|---|---|---|---|
| Gannon Richard W | -- | None Available | |
| Clifford W Gannon Revocable Living Trust | $145,000 | Ort | |
| Emerson Alan | $140,000 | -- | |
| Mueller Paul M | $131,200 | -- | |
| Margaret C Ulm Hillmer Revocable Living | -- | -- |
Source: Public Records
Mortgage History
| Date | Status | Borrower | Loan Amount |
|---|---|---|---|
| Open | Gannon Richard W | $177,361 |
Source: Public Records
Tax History Compared to Growth
Tax History
| Year | Tax Paid | Tax Assessment Tax Assessment Total Assessment is a certain percentage of the fair market value that is determined by local assessors to be the total taxable value of land and additions on the property. | Land | Improvement |
|---|---|---|---|---|
| 2025 | $2,599 | $46,360 | $14,380 | $31,980 |
| 2024 | $2,599 | $39,070 | $8,190 | $30,880 |
| 2023 | $2,599 | $39,070 | $8,190 | $30,880 |
| 2022 | $2,522 | $35,970 | $9,920 | $26,050 |
| 2021 | $2,511 | $35,970 | $9,920 | $26,050 |
| 2020 | $2,417 | $33,230 | $7,450 | $25,780 |
| 2019 | $2,364 | $33,230 | $7,450 | $25,780 |
| 2018 | $2,481 | $32,360 | $4,960 | $27,400 |
| 2017 | $2,414 | $32,360 | $4,960 | $27,400 |
| 2016 | $2,296 | $29,230 | $4,470 | $24,760 |
| 2015 | $2,406 | $29,230 | $4,470 | $24,760 |
| 2014 | $2,268 | $29,450 | $5,360 | $24,090 |
Source: Public Records
Map
Nearby Homes
- 2237 Ole Castle Ct
- 2224 Clayville Ct
- 718 Savannah Crossing Way
- 2166 Bantry Ct Unit 26A
- 14620 Amberleigh Hill Ct
- 14628 Amberleigh Hill Ct
- 713 Clayton Corners Dr
- 603 Rue Montand Dr
- 606 Rue Montand Dr
- 1870 Buckington Dr
- 1864 Oxborough Ct
- 1103 Sheffield Manor Ct
- 821 Heatherhaven Dr
- 14516 Crossway Ct
- 1091 Bristol Manor Dr
- 14265 Manderleigh Woods Dr
- 830 Courtwood Ln
- 520 Kingridge Dr
- 1685 Ansonborough Dr
- 1620 Chalmers Dr
- 2241 Ole Castle Ct Unit 1
- 2239 Ole Castle Ct Unit 22
- 2231 Ole Castle Ct Unit 2
- 2229 Ole Castle Ct
- 2233 Ole Castle Ct
- 2227 Ole Castle Ct
- 2253 Ole Castle Ct
- 2247 Ole Castle Ct Unit 3
- 2251 Ole Castle Ct
- 2222 Ole Castle Ct
- 2238 Ole Castle Ct
- 2224 Ole Castle Ct
- 2225 Ole Castle Ct
- 14414 Greencastle Dr
- 14410 Greencastle Dr
- 2219 Ole Castle Ct
- 2217 Ole Castle Ct
- 14418 Greencastle Dr Unit 3
- 14422 Greencastle Dr Unit 4
- 2221 Ole Castle Ct Unit 1