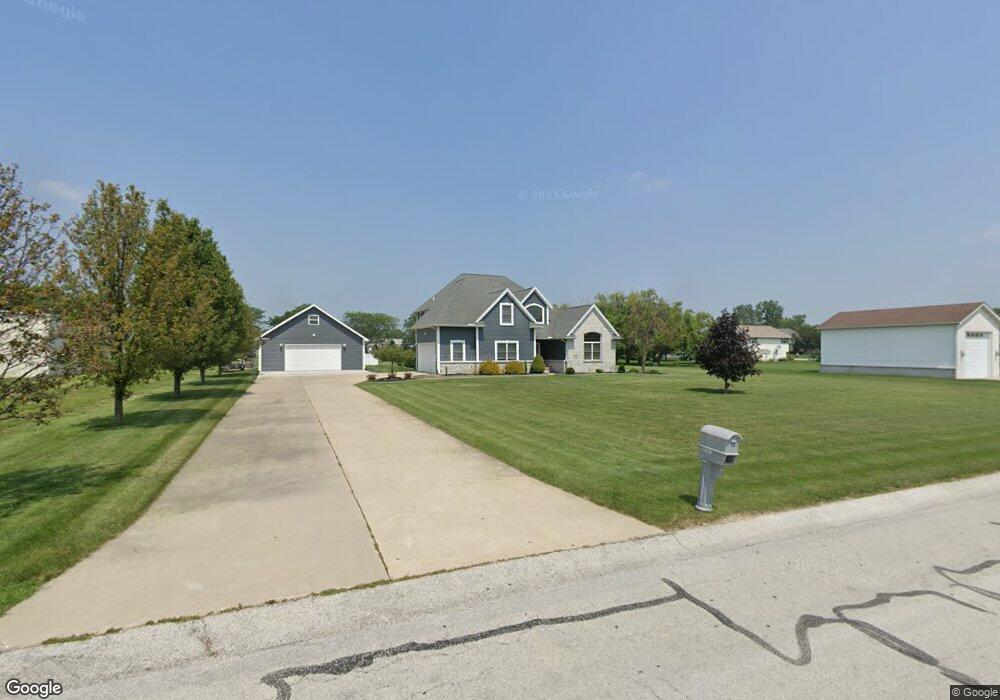
22393 W Red Clover Ln Curtice, OH 43412
Estimated Value: $453,474 - $474,000
3
Beds
4
Baths
2,244
Sq Ft
$208/Sq Ft
Est. Value
About This Home
This home is located at 22393 W Red Clover Ln, Curtice, OH 43412 and is currently estimated at $467,369, approximately $208 per square foot. 22393 W Red Clover Ln is a home located in Ottawa County with nearby schools including Genoa Elementary School.
Ownership History
Date
Name
Owned For
Owner Type
Purchase Details
Closed on
Jul 25, 2012
Sold by
Schwamberger Troy S
Bought by
Schwamberger Troy S and Schwamberger Michele A
Current Estimated Value
Home Financials for this Owner
Home Financials are based on the most recent Mortgage that was taken out on this home.
Original Mortgage
$212,200
Outstanding Balance
$91,354
Interest Rate
3.65%
Mortgage Type
New Conventional
Estimated Equity
$376,015
Purchase Details
Closed on
Feb 21, 2004
Sold by
Klorer James L
Bought by
New Horizons Remodeling & Building Co Ll
Home Financials for this Owner
Home Financials are based on the most recent Mortgage that was taken out on this home.
Original Mortgage
$25,600
Interest Rate
5.74%
Mortgage Type
Purchase Money Mortgage
Create a Home Valuation Report for This Property
The Home Valuation Report is an in-depth analysis detailing your home's value as well as a comparison with similar homes in the area
Home Values in the Area
Average Home Value in this Area
Purchase History
| Date | Buyer | Sale Price | Title Company |
|---|---|---|---|
| Schwamberger Troy S | -- | None Available | |
| New Horizons Remodeling & Building Co Ll | $32,000 | Buckeye Title |
Source: Public Records
Mortgage History
| Date | Status | Borrower | Loan Amount |
|---|---|---|---|
| Open | Schwamberger Troy S | $212,200 | |
| Previous Owner | New Horizons Remodeling & Building Co Ll | $25,600 |
Source: Public Records
Tax History Compared to Growth
Tax History
| Year | Tax Paid | Tax Assessment Tax Assessment Total Assessment is a certain percentage of the fair market value that is determined by local assessors to be the total taxable value of land and additions on the property. | Land | Improvement |
|---|---|---|---|---|
| 2024 | $6,026 | $133,221 | $14,900 | $118,321 |
| 2023 | $6,026 | $99,386 | $11,921 | $87,465 |
| 2022 | $5,091 | $99,386 | $11,921 | $87,465 |
| 2021 | $4,492 | $99,390 | $11,920 | $87,470 |
| 2020 | $3,914 | $82,370 | $8,220 | $74,150 |
| 2019 | $3,884 | $82,370 | $8,220 | $74,150 |
| 2018 | $3,740 | $82,370 | $8,220 | $74,150 |
| 2017 | $3,280 | $68,340 | $7,470 | $60,870 |
| 2016 | $3,292 | $68,340 | $7,470 | $60,870 |
| 2015 | $3,313 | $68,340 | $7,470 | $60,870 |
| 2014 | $1,465 | $65,290 | $7,470 | $57,820 |
| 2013 | $2,939 | $65,290 | $7,470 | $57,820 |
Source: Public Records
Map
Nearby Homes
- 6927 N Wildacre Rd
- 21224 W Toledo St
- 7330 Jerusalem Rd
- 24181 W James Ridge Rd
- 0 W Walbridge Rd
- Track 1 W Walbridge Rd
- 19367 W Walbridge Rd
- 5401 Pickle Rd
- 6645 Seaman Rd
- 5300 Williston Rd
- 9015 Seaman Rd
- 180 S Stadium Rd
- 5101 Wynn Park Dr
- 6530 Corduroy Rd
- 445 S Yondota Rd
- 730 Bradner Rd
- 4777 Williston Rd
- 5415 Seaman Rd
- 5040 Easton Dr
- 5036 Easton Dr
- 6660 Thistledown Ct
- 6680 Thistledown Ct
- 22481 W Red Clover Ln
- 6688 Thistledown Ct
- 6649 N Wildacre Rd
- 6731 N Wildacre Rd
- 22390 W Red Clover Ln
- 6711 N Wildacre Rd
- 22461 W Red Clover Ln
- 6661 Thistledown Ct
- 6621 N Wildacre Rd
- 6681 Thistledown Ct
- 22488 W Red Clover Ln
- 6691 Thistledown Ct
- 6741 N Wildacre Rd
- 22480 W Red Clover Ln
- 22431 W Red Clover Ln
- 6763 N Wildacre Rd
- 22331 Hollyhock Ln
- 6680 Goldenrod Ct