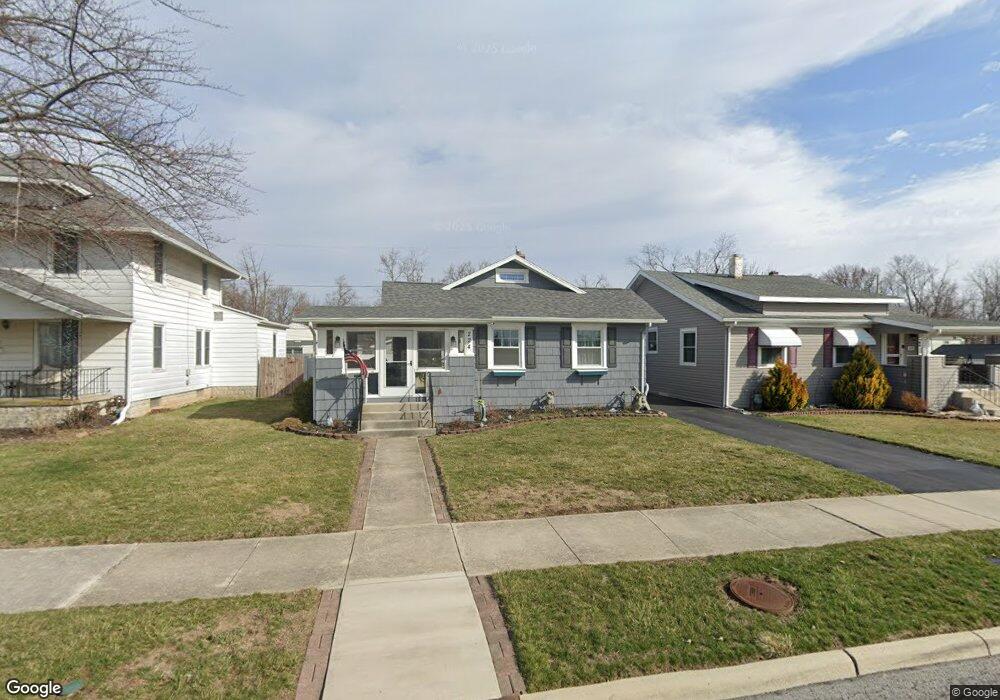
224 18th St Findlay, OH 45840
Estimated Value: $142,851 - $176,000
2
Beds
1
Bath
1,064
Sq Ft
$148/Sq Ft
Est. Value
About This Home
This home is located at 224 18th St, Findlay, OH 45840 and is currently estimated at $157,463, approximately $147 per square foot. 224 18th St is a home located in Hancock County with nearby schools including Northview Elementary School, Bigelow Hill Elementary School, and Glenwood Middle School.
Ownership History
Date
Name
Owned For
Owner Type
Purchase Details
Closed on
Oct 28, 2005
Sold by
Hottinger Nicholas J and Hottinger Brianne
Bought by
Weiler Patty L
Current Estimated Value
Home Financials for this Owner
Home Financials are based on the most recent Mortgage that was taken out on this home.
Original Mortgage
$88,000
Outstanding Balance
$1,232
Interest Rate
5.8%
Mortgage Type
Fannie Mae Freddie Mac
Estimated Equity
$156,231
Purchase Details
Closed on
May 3, 2002
Sold by
Gaberdiel Gina M
Bought by
Hottinger Nicholas J
Home Financials for this Owner
Home Financials are based on the most recent Mortgage that was taken out on this home.
Original Mortgage
$83,500
Interest Rate
7.18%
Mortgage Type
New Conventional
Purchase Details
Closed on
Nov 25, 1996
Sold by
Est Margaret Davis
Bought by
Gaberdiel Gina
Home Financials for this Owner
Home Financials are based on the most recent Mortgage that was taken out on this home.
Original Mortgage
$55,150
Interest Rate
7.94%
Mortgage Type
New Conventional
Purchase Details
Closed on
Feb 20, 1991
Bought by
Davis Margaret J
Create a Home Valuation Report for This Property
The Home Valuation Report is an in-depth analysis detailing your home's value as well as a comparison with similar homes in the area
Home Values in the Area
Average Home Value in this Area
Purchase History
| Date | Buyer | Sale Price | Title Company |
|---|---|---|---|
| Weiler Patty L | $98,000 | Whitman Title Security | |
| Hottinger Nicholas J | $83,500 | -- | |
| Gaberdiel Gina | $58,100 | -- | |
| Davis Margaret J | -- | -- |
Source: Public Records
Mortgage History
| Date | Status | Borrower | Loan Amount |
|---|---|---|---|
| Open | Weiler Patty L | $88,000 | |
| Previous Owner | Hottinger Nicholas J | $83,500 | |
| Previous Owner | Gaberdiel Gina | $55,150 |
Source: Public Records
Tax History
| Year | Tax Paid | Tax Assessment Tax Assessment Total Assessment is a certain percentage of the fair market value that is determined by local assessors to be the total taxable value of land and additions on the property. | Land | Improvement |
|---|---|---|---|---|
| 2024 | $1,361 | $38,300 | $4,280 | $34,020 |
| 2023 | $1,363 | $38,300 | $4,280 | $34,020 |
| 2022 | $1,358 | $38,300 | $4,280 | $34,020 |
| 2021 | $1,160 | $28,510 | $4,290 | $24,220 |
| 2020 | $1,160 | $28,510 | $4,290 | $24,220 |
| 2019 | $1,137 | $28,510 | $4,290 | $24,220 |
| 2018 | $1,080 | $24,860 | $3,730 | $21,130 |
| 2017 | $1,081 | $24,860 | $3,730 | $21,130 |
| 2016 | $1,075 | $24,860 | $3,730 | $21,130 |
| 2015 | $1,026 | $23,460 | $3,430 | $20,030 |
| 2014 | $1,026 | $23,460 | $3,430 | $20,030 |
| 2012 | $1,034 | $23,460 | $3,430 | $20,030 |
Source: Public Records
Map
Nearby Homes
- 146 Clifton Ave
- 140 Monroe Ave
- 1820 Gayle Ln
- 145 Madison Ave
- 232 Prentiss Ave
- 301 Allen Ave
- 206 Midland Ave
- 322 Midland Ave
- 239 Edith Ave
- 241 Stanley Ave
- 315 W Melrose Ave
- 329 W Melrose Ave
- 421 Clifton Ave
- 2400 Hollybrook Dr
- 2604 N Main St
- 204 Laquineo St
- 528 Rector Ave
- 128 Harrington Ave
- 245 Edinborough Dr
- 0 E Melrose Ave
Your Personal Tour Guide
Ask me questions while you tour the home.