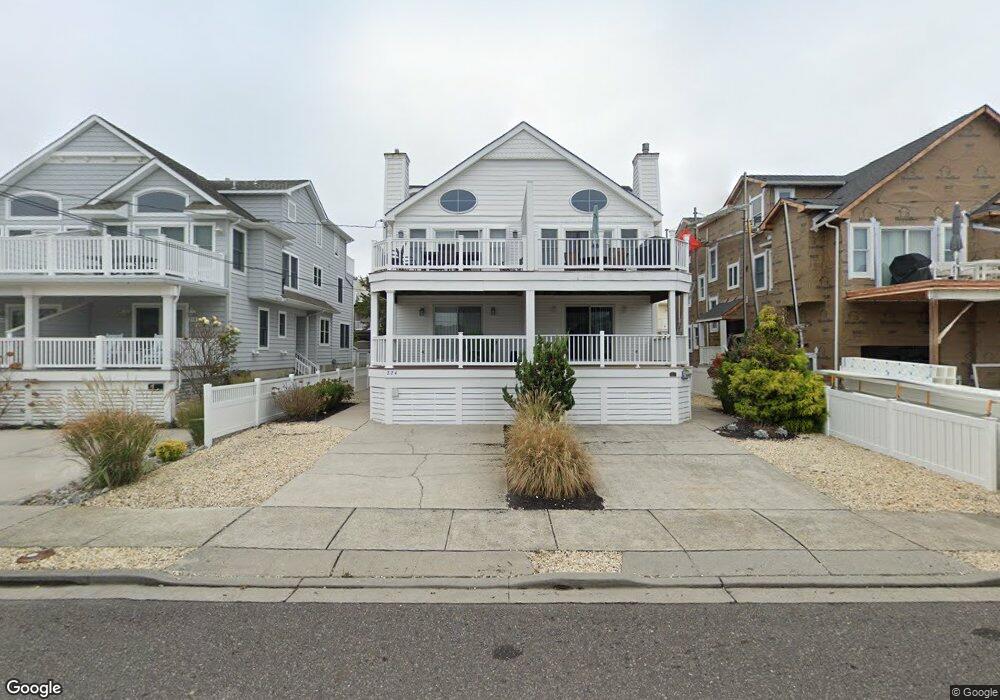
224 34th St Avalon, NJ 08202
Estimated Value: $1,943,678 - $2,202,000
Studio
--
Bath
1,960
Sq Ft
$1,064/Sq Ft
Est. Value
About This Home
This home is located at 224 34th St, Avalon, NJ 08202 and is currently estimated at $2,085,420, approximately $1,063 per square foot. 224 34th St is a home located in Cape May County with nearby schools including Avalon Elementary School.
Ownership History
Date
Name
Owned For
Owner Type
Purchase Details
Closed on
Jan 31, 2003
Sold by
Anderson Diane M
Bought by
Ryan Patrick J and Ryan Leslie C
Current Estimated Value
Home Financials for this Owner
Home Financials are based on the most recent Mortgage that was taken out on this home.
Original Mortgage
$427,500
Outstanding Balance
$184,955
Interest Rate
6.09%
Estimated Equity
$1,900,465
Purchase Details
Closed on
Apr 23, 2001
Sold by
Michel & Co Inc
Bought by
Anderson Diane M
Home Financials for this Owner
Home Financials are based on the most recent Mortgage that was taken out on this home.
Original Mortgage
$367,920
Interest Rate
6.85%
Purchase Details
Closed on
Nov 13, 2000
Sold by
Michel & Company Inc
Bought by
Zisak Frank X
Home Financials for this Owner
Home Financials are based on the most recent Mortgage that was taken out on this home.
Original Mortgage
$325,000
Interest Rate
7.39%
Create a Home Valuation Report for This Property
The Home Valuation Report is an in-depth analysis detailing your home's value as well as a comparison with similar homes in the area
Home Values in the Area
Average Home Value in this Area
Purchase History
| Date | Buyer | Sale Price | Title Company |
|---|---|---|---|
| Ryan Patrick J | $570,000 | -- | |
| Anderson Diane M | $459,900 | -- | |
| Zisak Frank X | $419,900 | -- |
Source: Public Records
Mortgage History
| Date | Status | Borrower | Loan Amount |
|---|---|---|---|
| Open | Ryan Patrick J | $427,500 | |
| Previous Owner | Anderson Diane M | $367,920 | |
| Previous Owner | Zisak Frank X | $325,000 |
Source: Public Records
Tax History
| Year | Tax Paid | Tax Assessment Tax Assessment Total Assessment is a certain percentage of the fair market value that is determined by local assessors to be the total taxable value of land and additions on the property. | Land | Improvement |
|---|---|---|---|---|
| 2025 | $5,331 | $868,200 | $600,000 | $268,200 |
| 2024 | $5,331 | $868,200 | $600,000 | $268,200 |
| 2023 | $5,287 | $868,200 | $600,000 | $268,200 |
| 2022 | $4,931 | $868,200 | $600,000 | $268,200 |
| 2021 | $4,749 | $868,200 | $600,000 | $268,200 |
| 2020 | $4,567 | $868,200 | $600,000 | $268,200 |
| 2019 | $4,428 | $868,200 | $600,000 | $268,200 |
| 2018 | $4,237 | $868,200 | $600,000 | $268,200 |
| 2017 | $3,588 | $645,300 | $400,000 | $245,300 |
| 2016 | $3,549 | $645,300 | $400,000 | $245,300 |
| 2015 | $3,491 | $645,300 | $400,000 | $245,300 |
| 2014 | $3,452 | $645,300 | $400,000 | $245,300 |
Source: Public Records
Map
Nearby Homes
- 253 35th St Unit WEST
- 3429 Dune Dr
- 173 33rd St Unit 3
- 179 32nd St
- 3027 Dune Dr Unit 3
- 2934 Ocean Dr Unit North
- 2928 Ocean Dr Unit C-N
- 3149 First Ave
- 2988 1st Ave
- 2968 First Ave
- 55 32nd St W Unit C2B
- 55 32nd St W
- 55 32nd St W Unit 1A
- 25 32nd St W
- 360 39th St Unit East
- 4028 Ocean Dr Unit 2nd floor
- 2958 Avalon Ave
- 179 27th St
- 198 40th St
- 4040 Dune Dr
- 216 34th St
- 214 34th St Unit 214
- 226 34th St
- 234 34th St
- 3434 Dune Dr Unit NORTH
- 3434 Dune Dr
- 236 34th St
- 236 34th St Unit West
- 213 34th St
- 3446 Dune Dr
- 3446 Dune Dr Unit NORTH
- 3446 Dune Dr Unit North Unit
- 246 34th St
- 246 34th St
- 215 34th St
- 223 34th St Unit 223
- 213 35th St
- 225 34th St
- 225 34th St Unit West side
- 211 35th St
Your Personal Tour Guide
Ask me questions while you tour the home.