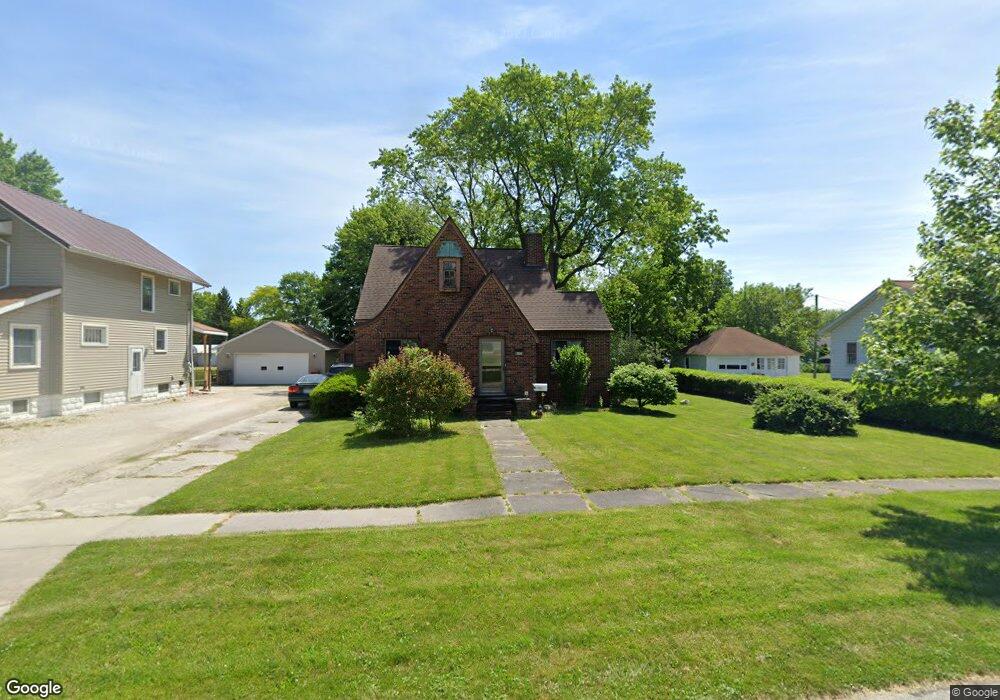
224 Adams St Luckey, OH 43443
Estimated Value: $180,000 - $253,000
4
Beds
1
Bath
1,485
Sq Ft
$137/Sq Ft
Est. Value
About This Home
This home is located at 224 Adams St, Luckey, OH 43443 and is currently estimated at $203,650, approximately $137 per square foot. 224 Adams St is a home with nearby schools including Pemberville Elementary School, Eastwood Middle School, and Eastwood High School.
Ownership History
Date
Name
Owned For
Owner Type
Purchase Details
Closed on
Feb 25, 2020
Sold by
Heckman Robert E
Bought by
Heckman Dollie C
Current Estimated Value
Purchase Details
Closed on
Jan 1, 1990
Bought by
Heckman Robert E
Create a Home Valuation Report for This Property
The Home Valuation Report is an in-depth analysis detailing your home's value as well as a comparison with similar homes in the area
Home Values in the Area
Average Home Value in this Area
Purchase History
| Date | Buyer | Sale Price | Title Company |
|---|---|---|---|
| Heckman Dollie C | -- | -- | |
| Heckman Robert E | -- | -- |
Source: Public Records
Tax History Compared to Growth
Tax History
| Year | Tax Paid | Tax Assessment Tax Assessment Total Assessment is a certain percentage of the fair market value that is determined by local assessors to be the total taxable value of land and additions on the property. | Land | Improvement |
|---|---|---|---|---|
| 2024 | $1,438 | $46,620 | $5,285 | $41,335 |
| 2023 | $1,438 | $46,630 | $5,290 | $41,340 |
| 2022 | $1,307 | $39,140 | $5,290 | $33,850 |
| 2021 | $1,294 | $39,140 | $5,290 | $33,850 |
| 2020 | $1,306 | $39,140 | $5,290 | $33,850 |
| 2019 | $1,167 | $34,730 | $5,290 | $29,440 |
| 2018 | $1,165 | $34,730 | $5,290 | $29,440 |
| 2017 | $1,102 | $34,730 | $5,290 | $29,440 |
| 2016 | $1,042 | $33,780 | $5,290 | $28,490 |
| 2015 | $1,042 | $33,780 | $5,290 | $28,490 |
| 2014 | $1,169 | $33,780 | $5,290 | $28,490 |
| 2013 | $1,233 | $33,780 | $5,290 | $28,490 |
Source: Public Records
Map
Nearby Homes
- 210 School St
- 3291 Middleton Pike
- 19350 Luckey Rd
- 0 Pemberville Rd
- 420 Linden Dr
- 424 Linden Dr
- 423 Linden Dr
- 449 Linden Dr
- 425 Linden Dr
- 457 Linden Dr
- 426 Linden Dr
- 421 Linden Dr
- 451 Linden Dr
- 447 Linden Dr
- 459 Linden Dr
- 427 Linden Dr
- 2067 Devils Hole Rd
- 151 Marshall Ave
- 150 Marshall Ave
- 124 Bond St