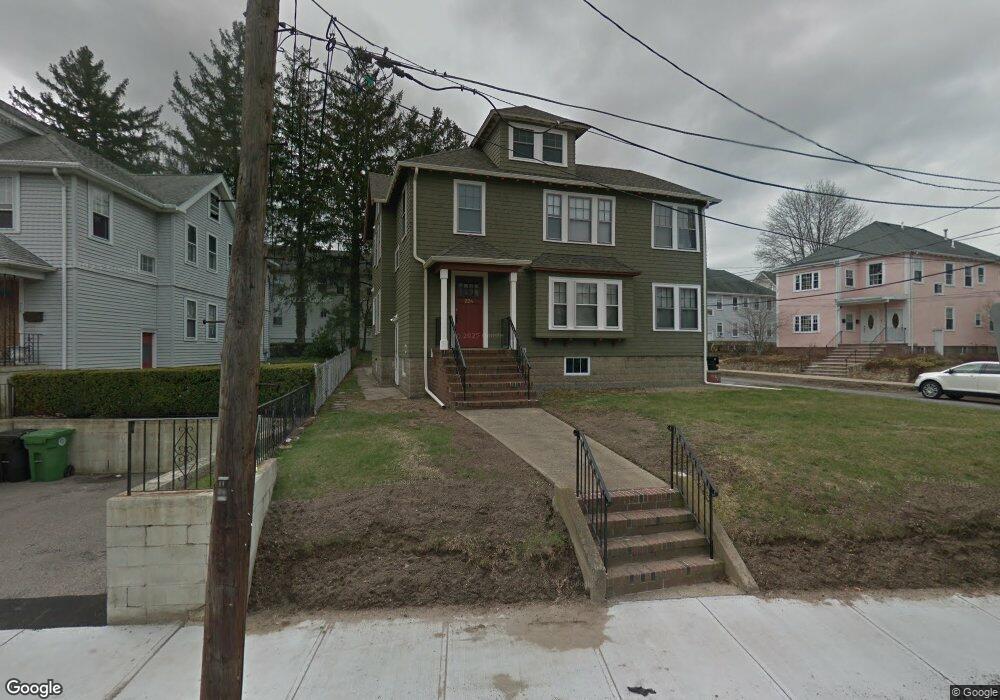
224 Belmont St Watertown, MA 02472
East Watertown NeighborhoodEstimated Value: $1,076,000 - $1,234,099
4
Beds
2
Baths
2,800
Sq Ft
$418/Sq Ft
Est. Value
About This Home
This home is located at 224 Belmont St, Watertown, MA 02472 and is currently estimated at $1,169,275, approximately $417 per square foot. 224 Belmont St is a home located in Middlesex County with nearby schools including Atrium School, St. Stephen's Armenian Elementary School, and The Kendall School.
Ownership History
Date
Name
Owned For
Owner Type
Purchase Details
Closed on
Dec 27, 2012
Sold by
Ayer Francois N
Bought by
Giardella Daena and Ross Wren
Current Estimated Value
Home Financials for this Owner
Home Financials are based on the most recent Mortgage that was taken out on this home.
Original Mortgage
$368,100
Outstanding Balance
$256,060
Interest Rate
3.38%
Mortgage Type
New Conventional
Estimated Equity
$913,215
Create a Home Valuation Report for This Property
The Home Valuation Report is an in-depth analysis detailing your home's value as well as a comparison with similar homes in the area
Home Values in the Area
Average Home Value in this Area
Purchase History
| Date | Buyer | Sale Price | Title Company |
|---|---|---|---|
| Giardella Daena | $460,125 | -- |
Source: Public Records
Mortgage History
| Date | Status | Borrower | Loan Amount |
|---|---|---|---|
| Open | Giardella Daena | $368,100 | |
| Closed | Giardella Daena | $368,100 |
Source: Public Records
Tax History Compared to Growth
Tax History
| Year | Tax Paid | Tax Assessment Tax Assessment Total Assessment is a certain percentage of the fair market value that is determined by local assessors to be the total taxable value of land and additions on the property. | Land | Improvement |
|---|---|---|---|---|
| 2025 | $11,227 | $961,200 | $468,500 | $492,700 |
| 2024 | $10,405 | $889,300 | $468,900 | $420,400 |
| 2023 | $11,809 | $869,600 | $461,400 | $408,200 |
| 2022 | $10,942 | $825,800 | $416,000 | $409,800 |
| 2021 | $9,573 | $781,500 | $385,700 | $395,800 |
| 2020 | $9,389 | $773,400 | $385,700 | $387,700 |
| 2019 | $8,877 | $689,200 | $366,800 | $322,400 |
| 2018 | $8,481 | $629,600 | $336,600 | $293,000 |
| 2017 | $8,587 | $618,200 | $325,200 | $293,000 |
| 2016 | $8,276 | $605,000 | $312,000 | $293,000 |
| 2015 | $7,578 | $504,200 | $283,600 | $220,600 |
| 2014 | $7,148 | $477,800 | $257,200 | $220,600 |
Source: Public Records
Map
Nearby Homes
- 133 Hillside Rd
- 56-58 Edgecliff Rd
- 87 Templeton Pkwy Unit 3
- 10 Marlboro St Unit 1
- 276 Belmont St Unit 1
- 163 Belmont St
- 30 Unity Ave Unit 30
- 73 Foster Rd Unit 2
- 81 Winsor Ave
- 16 Ericsson St
- 43 Irma Ave Unit 43
- 1 Clayton St
- 25 Francis St Unit 2
- 25 Francis St Unit 1
- 238 Arlington St Unit 238
- 161 Cushing St
- 66 Holworthy St
- 87 Holworthy St Unit 2
- 87 Holworthy St Unit 3
- 85 Dexter Ave Unit 87
- 220 Belmont St Unit 2
- 218 Belmont St Unit 220
- 12 Woodleigh Rd
- 7 Woodleigh Rd
- 7 Woodleigh Rd Unit 2
- 7 Woodleigh Rd Unit 1
- 11 Woodleigh Rd Unit 2
- 11 Woodleigh Rd Unit 1
- 3 Woodleigh Rd
- 3 Woodleigh Rd Unit 2
- 3 Woodleigh Rd Unit 1
- 18 Woodleigh Rd
- 17 Woodleigh Rd Unit 2
- 17 Woodleigh Rd Unit 1
- 17 Woodleigh Rd Unit 1-17
- 17 Woodleigh Rd Unit 2-17
- 17 Woodleigh Rd Unit 17
- 215 Belmont St
- 211 Belmont St
- 12 Westland Rd Unit 14