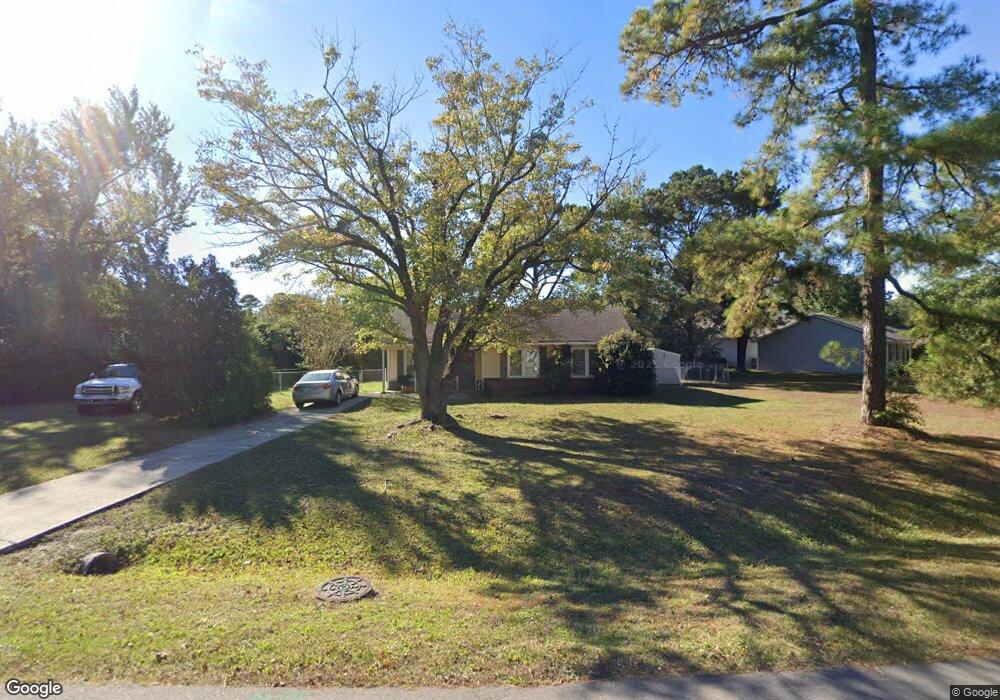
224 Buff Cir Wilmington, NC 28411
Estimated Value: $277,000 - $307,000
3
Beds
2
Baths
1,067
Sq Ft
$278/Sq Ft
Est. Value
About This Home
This home is located at 224 Buff Cir, Wilmington, NC 28411 and is currently estimated at $296,714, approximately $278 per square foot. 224 Buff Cir is a home located in New Hanover County with nearby schools including Ogden Elementary School, M.C.S. Noble Middle School, and Emsley A. Laney High School.
Ownership History
Date
Name
Owned For
Owner Type
Purchase Details
Closed on
Aug 27, 2012
Sold by
Scharrer Margaret G
Bought by
Scharrer Margaret G and Ernest A Garbade Revocable Living Trust
Current Estimated Value
Purchase Details
Closed on
Mar 8, 2011
Sold by
Kramer Robert P and Kramer Elizabeth M
Bought by
Scharrer Margaret G and Edith G Shank Living Trust
Purchase Details
Closed on
Jul 22, 2002
Sold by
Toplin Robert B Karin L Bendel
Bought by
Kramer Robert P
Purchase Details
Closed on
Jul 17, 2000
Sold by
Toplin Aida Z
Bought by
Toplin Robert Brent
Purchase Details
Closed on
Nov 8, 1996
Sold by
Toplin Robert B Aida Z
Bought by
Toplin Aida Z
Purchase Details
Closed on
Aug 1, 1984
Sold by
Nieding Betty
Bought by
Toplin Robert Aida
Purchase Details
Closed on
Dec 1, 1981
Sold by
Inlet Const Inc
Bought by
Nieding Betty
Purchase Details
Closed on
Aug 1, 1979
Bought by
Inlet Const Inc
Create a Home Valuation Report for This Property
The Home Valuation Report is an in-depth analysis detailing your home's value as well as a comparison with similar homes in the area
Home Values in the Area
Average Home Value in this Area
Purchase History
| Date | Buyer | Sale Price | Title Company |
|---|---|---|---|
| Scharrer Margaret G | -- | None Available | |
| Scharrer Margaret G | $100,000 | None Available | |
| Kramer Robert P | $70,500 | -- | |
| Toplin Robert Brent | -- | -- | |
| Toplin Aida Z | -- | -- | |
| Toplin Robert Aida | $42,500 | -- | |
| Nieding Betty | -- | -- | |
| Inlet Const Inc | -- | -- |
Source: Public Records
Tax History Compared to Growth
Tax History
| Year | Tax Paid | Tax Assessment Tax Assessment Total Assessment is a certain percentage of the fair market value that is determined by local assessors to be the total taxable value of land and additions on the property. | Land | Improvement |
|---|---|---|---|---|
| 2025 | $1,262 | $314,000 | $126,900 | $187,100 |
| 2023 | $944 | $166,600 | $72,100 | $94,500 |
| 2022 | $947 | $166,600 | $72,100 | $94,500 |
| 2021 | $924 | $166,600 | $72,100 | $94,500 |
| 2020 | $754 | $119,200 | $50,100 | $69,100 |
| 2019 | $754 | $119,200 | $50,100 | $69,100 |
| 2018 | $0 | $119,200 | $50,100 | $69,100 |
| 2017 | $772 | $119,200 | $50,100 | $69,100 |
| 2016 | $784 | $113,100 | $52,000 | $61,100 |
| 2015 | $728 | $113,100 | $52,000 | $61,100 |
| 2014 | $716 | $113,100 | $52,000 | $61,100 |
Source: Public Records
Map
Nearby Homes
- 233 Buff Cir
- 7140 Arbor Oaks Dr
- 7124 Arbor Oaks Dr
- 7223 Lounsberry Ct
- 217 Cannon Rd
- 6509 Old Fort Rd
- 628 Middle Sound Loop Rd
- 7048 Ruth Ave
- 75 Snug Harbour Dr
- 6420 Old Fort Rd
- 304 Halyard Ct
- 6122 Timber Creek Ln
- 7101 Medallion Place
- 3521 Middle Sound Loop Rd
- 7343 Bright Leaf Rd
- 7006 Key Point Dr
- 106 E Brandywine Cir
- 7125 Saybrook Dr Unit LT15
- 7124 Maple Leaf Dr
- 608 Countryside Ln