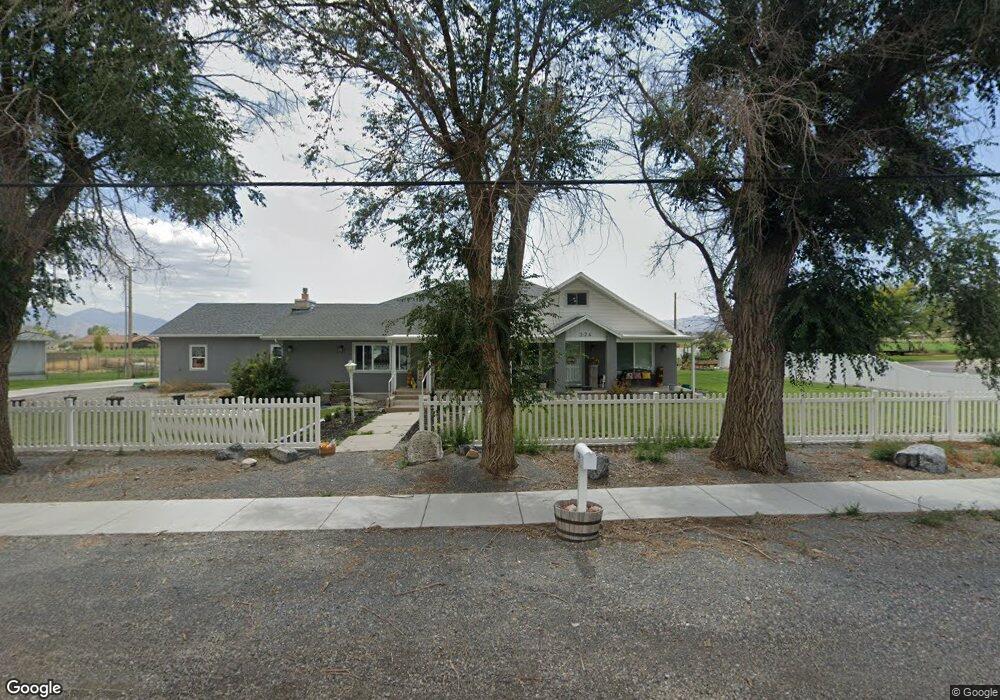
224 E Durfee St Grantsville, UT 84029
Estimated Value: $531,000 - $601,000
Studio
--
Bath
2,424
Sq Ft
$234/Sq Ft
Est. Value
About This Home
This home is located at 224 E Durfee St, Grantsville, UT 84029 and is currently estimated at $566,919, approximately $233 per square foot. 224 E Durfee St is a home with nearby schools including Willow Elementary School, Grantsville Junior High School, and Grantsville High School.
Ownership History
Date
Name
Owned For
Owner Type
Purchase Details
Closed on
Jul 1, 2020
Sold by
Caldwell Kathryn J and Ortiz Valerie J
Bought by
Caldwell Kathryn J and Caldwell Christopher John
Current Estimated Value
Home Financials for this Owner
Home Financials are based on the most recent Mortgage that was taken out on this home.
Original Mortgage
$250,000
Outstanding Balance
$222,095
Interest Rate
3.2%
Mortgage Type
New Conventional
Estimated Equity
$344,824
Purchase Details
Closed on
Dec 20, 2019
Sold by
Baird Bengala Flores and Sengala Flores Baird Rlt
Bought by
Caldwell Kathryn J and Ortiz Valerie J
Home Financials for this Owner
Home Financials are based on the most recent Mortgage that was taken out on this home.
Original Mortgage
$160,000
Interest Rate
3.6%
Mortgage Type
New Conventional
Purchase Details
Closed on
Jul 21, 2015
Sold by
Baird Bengala F
Bought by
Baird Bengala Flores and Bengala Flores Baird Revocable
Create a Home Valuation Report for This Property
The Home Valuation Report is an in-depth analysis detailing your home's value as well as a comparison with similar homes in the area
Purchase History
| Date | Buyer | Sale Price | Title Company |
|---|---|---|---|
| Caldwell Kathryn J | -- | Inwest Title Tooele Office | |
| Caldwell Kathryn J | -- | Inwest Title Tooele Office | |
| Baird Bengala Flores | -- | None Available |
Source: Public Records
Mortgage History
| Date | Status | Borrower | Loan Amount |
|---|---|---|---|
| Open | Caldwell Kathryn J | $250,000 | |
| Closed | Caldwell Kathryn J | $160,000 |
Source: Public Records
Tax History
| Year | Tax Paid | Tax Assessment Tax Assessment Total Assessment is a certain percentage of the fair market value that is determined by local assessors to be the total taxable value of land and additions on the property. | Land | Improvement |
|---|---|---|---|---|
| 2025 | $3,844 | $628,657 | $140,800 | $487,857 |
| 2024 | $3,596 | $293,576 | $77,440 | $216,136 |
| 2023 | $3,596 | $270,292 | $58,520 | $211,772 |
| 2022 | $3,881 | $357,173 | $65,868 | $291,305 |
| 2021 | $3,170 | $237,925 | $43,093 | $194,832 |
| 2020 | $2,727 | $360,371 | $78,350 | $282,021 |
| 2019 | $724 | $331,358 | $55,000 | $276,358 |
| 2018 | $542 | $270,246 | $55,000 | $215,246 |
| 2017 | $1,853 | $229,504 | $55,000 | $174,504 |
| 2016 | $1,785 | $123,271 | $30,250 | $93,021 |
| 2015 | $1,785 | $123,271 | $0 | $0 |
| 2014 | -- | $47,717 | $0 | $0 |
Source: Public Records
Map
Nearby Homes
- 241 S Quirk St
- 277 S Holden Ln
- 268 E Carly Dr
- 424 W Domain Ln
- 273 E Cherry St
- 88 Orchard Ln
- 336 E Pear St Unit 118
- 429 E Stafford St Unit 135
- 437 E Stafford St Unit 136
- 111 S Jodi Ln
- 40 E Main St
- 348 E Main St
- 340 S Amber Dr
- 361 E Main St
- 125 S Freedom Way Unit 216
- 251 E Clark St
- 342 S Banister Ln
- 51 N Hale St
- 525 S Hale St
- 37 E Clark St
- 330 S Quirk St
- 330 S Quirk St
- 230 E Durfee St
- 198 E Durfee St
- 225 E Durfee St
- 231 E Durfee St
- 199 E Durfee St
- 283 Quirk St
- 283 Quirk St Unit 4
- 283 Quirk St Unit 7
- 283 Quirk St Unit 13
- 283 Quirk St Unit 8
- 291 Quirk St
- 243 E Durfee St
- 242 E Durfee St
- 197 E Durfee St
- 241 E Durfee St
- 241 E Durfee St Unit 1
- 241 E Durfee St
- 294 Quirk St
Your Personal Tour Guide
Ask me questions while you tour the home.