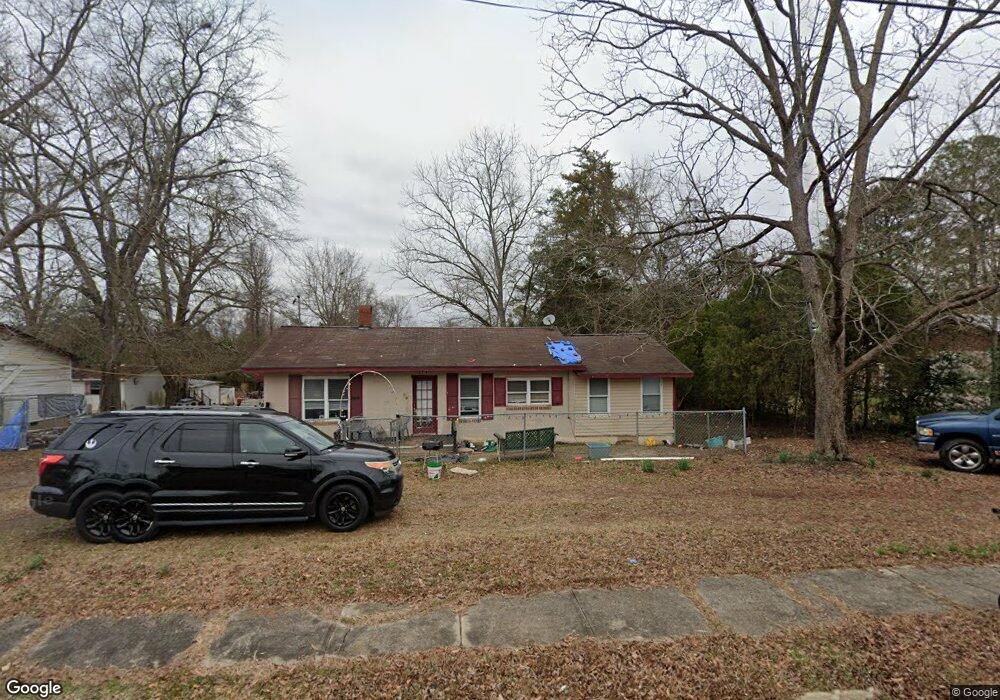
224 E Folsum St Mount Vernon, GA 30445
Estimated Value: $50,474 - $85,000
Studio
1
Bath
840
Sq Ft
$89/Sq Ft
Est. Value
About This Home
This home is located at 224 E Folsum St, Mount Vernon, GA 30445 and is currently estimated at $74,619, approximately $88 per square foot. 224 E Folsum St is a home located in Montgomery County with nearby schools including Montgomery County Elementary School, Montgomery County Middle School, and Montgomery County High School.
Ownership History
Date
Name
Owned For
Owner Type
Purchase Details
Closed on
Sep 18, 2015
Sold by
Peterson Ray P
Bought by
Yawn Roderick James and Yawn Kimberly Reynolds
Current Estimated Value
Home Financials for this Owner
Home Financials are based on the most recent Mortgage that was taken out on this home.
Original Mortgage
$30,308
Interest Rate
3.94%
Mortgage Type
New Conventional
Purchase Details
Closed on
Feb 1, 2006
Sold by
Phillips Valerie J
Bought by
Peterson Ray P and Peterson Rebecca P
Purchase Details
Closed on
Dec 7, 2001
Sold by
Phillips Robert and Phillips Al
Bought by
Phillips Valerie Je
Purchase Details
Closed on
Sep 3, 1992
Sold by
Avery Donald L
Bought by
Phillips Robert
Purchase Details
Closed on
Aug 17, 1970
Sold by
Phillips Joseph N
Bought by
Avery Donald L
Purchase Details
Closed on
Nov 22, 1967
Bought by
Phillips Joseph N
Create a Home Valuation Report for This Property
The Home Valuation Report is an in-depth analysis detailing your home's value as well as a comparison with similar homes in the area
Purchase History
| Date | Buyer | Sale Price | Title Company |
|---|---|---|---|
| Yawn Roderick James | $37,500 | -- | |
| Peterson Ray P | $30,600 | -- | |
| Phillips Valerie Je | -- | -- | |
| Phillips Robert | $14,000 | -- | |
| Avery Donald L | -- | -- | |
| Phillips Joseph N | -- | -- |
Source: Public Records
Mortgage History
| Date | Status | Borrower | Loan Amount |
|---|---|---|---|
| Closed | Yawn Roderick James | $30,308 |
Source: Public Records
Tax History
| Year | Tax Paid | Tax Assessment Tax Assessment Total Assessment is a certain percentage of the fair market value that is determined by local assessors to be the total taxable value of land and additions on the property. | Land | Improvement |
|---|---|---|---|---|
| 2025 | $397 | $13,420 | $1,294 | $12,126 |
| 2024 | $434 | $14,678 | $1,294 | $13,384 |
| 2023 | $439 | $14,678 | $1,294 | $13,384 |
| 2022 | $439 | $14,678 | $1,294 | $13,384 |
| 2021 | $436 | $14,678 | $1,294 | $13,384 |
| 2020 | $402 | $13,182 | $1,294 | $11,888 |
| 2019 | $394 | $13,182 | $1,294 | $11,888 |
| 2018 | $332 | $12,250 | $1,294 | $10,956 |
| 2017 | $332 | $12,250 | $1,294 | $10,956 |
| 2016 | $341 | $12,250 | $1,294 | $10,956 |
| 2015 | -- | $13,101 | $1,294 | $11,807 |
| 2014 | -- | $13,101 | $1,294 | $11,807 |
Source: Public Records
Map
Nearby Homes
- 343 Morrison St
- 203 E Church St
- 400 W Bluff St
- 540 Limestone St
- 580 Limestone St
- 705 Geiger St
- 118 Gum St
- 405 N Broughton St
- 111 Dead River Rd
- 100 E 2nd Ave
- 585 Old Savannah Rd
- 946 Old Savannah Rd
- 181 Stuckey Church Rd
- 0 S Highway 19 & Warm Spring Rd Unit 10675921
- 0 S Highway 19 & Warm Spring Rd Unit 10675961
- 1501 Old Savannah Rd
- 168 Timberloch Dr
- 3256 Georgia 29
- 750 Petross Rd
- 709 Bob Sharpe Rd
- 210 E Folsum St
- 234 E Folsum St
- 234 Ben Anderson St
- 321 N Calhoun St
- 315 Ben Anderson St
- 235 Folsum St
- 329 N Calhoun St
- 226 Ben Anderson St
- N Calhoun St
- 223 N Calhoun St
- 202 Oconnor St
- 308 E Folsum St
- 126 E Sadie St
- 233 Ben Anderson St
- 208 Ben Anderson St
- 409 N Calhoun St
- 314 E Folsum St
- 122 Sadie St
- 416 N Railroad Ave
- 207 Ben Anderson St
Your Personal Tour Guide
Ask me questions while you tour the home.