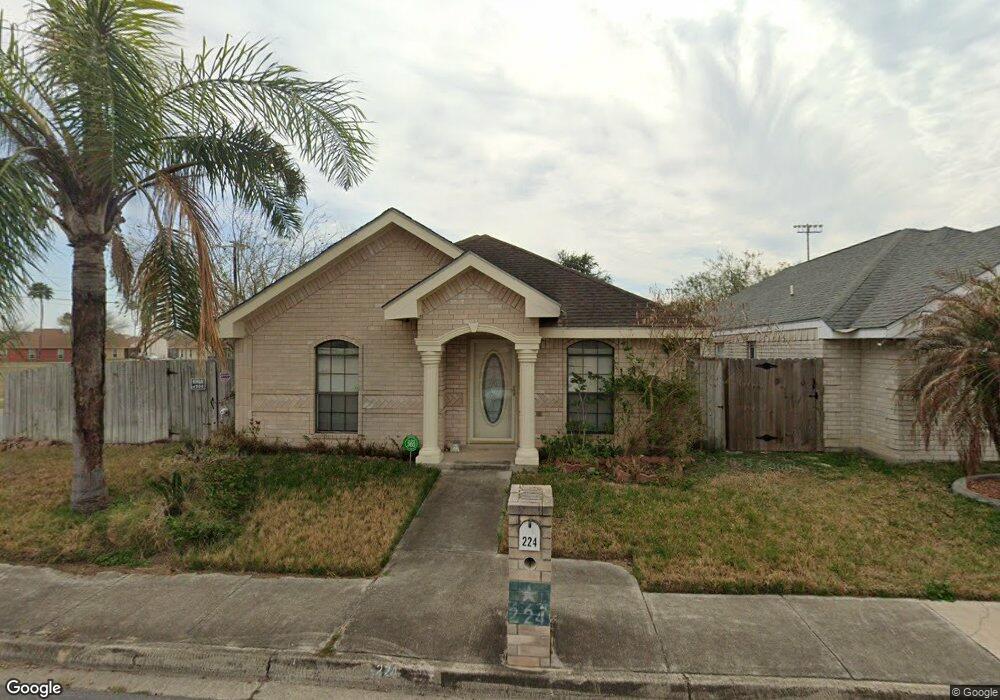
224 E Maple Ave McAllen, TX 78501
Estimated Value: $206,702 - $216,000
3
Beds
2
Baths
1,437
Sq Ft
$148/Sq Ft
Est. Value
About This Home
This home is located at 224 E Maple Ave, McAllen, TX 78501 and is currently estimated at $212,567, approximately $147 per square foot. 224 E Maple Ave is a home located in Hidalgo County with nearby schools including Jackson Elementary School, Cathey Middle School, and Memorial High School.
Ownership History
Date
Name
Owned For
Owner Type
Purchase Details
Closed on
Dec 27, 2010
Sold by
Bac Home Loans Servicing Lp
Bought by
Hinojosa Jaime A
Current Estimated Value
Home Financials for this Owner
Home Financials are based on the most recent Mortgage that was taken out on this home.
Original Mortgage
$87,523
Outstanding Balance
$59,585
Interest Rate
4.75%
Mortgage Type
FHA
Estimated Equity
$152,982
Purchase Details
Closed on
Oct 22, 2010
Sold by
Acosta Ceasar
Bought by
Bac Home Loans Servicing Lp and Countrywide Home Loans Servicing Lp
Purchase Details
Closed on
Apr 2, 2007
Sold by
Singleterry Belinda
Bought by
Acosta Ceasar
Home Financials for this Owner
Home Financials are based on the most recent Mortgage that was taken out on this home.
Original Mortgage
$112,500
Interest Rate
11.15%
Mortgage Type
Purchase Money Mortgage
Create a Home Valuation Report for This Property
The Home Valuation Report is an in-depth analysis detailing your home's value as well as a comparison with similar homes in the area
Purchase History
| Date | Buyer | Sale Price | Title Company |
|---|---|---|---|
| Hinojosa Jaime A | -- | San Jacinto Title Services | |
| Bac Home Loans Servicing Lp | $96,030 | None Available | |
| Acosta Ceasar | -- | Edwards Abstract & Title Co |
Source: Public Records
Mortgage History
| Date | Status | Borrower | Loan Amount |
|---|---|---|---|
| Open | Hinojosa Jaime A | $87,523 | |
| Previous Owner | Acosta Ceasar | $112,500 |
Source: Public Records
Tax History
| Year | Tax Paid | Tax Assessment Tax Assessment Total Assessment is a certain percentage of the fair market value that is determined by local assessors to be the total taxable value of land and additions on the property. | Land | Improvement |
|---|---|---|---|---|
| 2025 | $1,261 | $169,144 | -- | -- |
| 2024 | $1,261 | $153,767 | $32,208 | $121,559 |
| 2023 | $3,387 | $143,968 | $0 | $0 |
| 2022 | $3,246 | $130,880 | $0 | $0 |
| 2021 | $3,040 | $118,982 | $32,208 | $90,204 |
| 2020 | $2,759 | $108,165 | $25,163 | $83,002 |
| 2019 | $2,543 | $100,252 | $25,163 | $75,089 |
| 2018 | $2,547 | $100,252 | $20,130 | $80,122 |
| 2017 | $2,405 | $94,296 | $20,130 | $74,166 |
| 2016 | $2,405 | $94,296 | $20,130 | $74,166 |
| 2015 | $1,976 | $95,609 | $20,130 | $75,479 |
Source: Public Records
Map
Nearby Homes
- 209 E Maple Ave
- 200 E Nyssa Ave
- 100 E Pecan Blvd
- 131 E Quince Ave
- 1101 E Jasmine Ave
- 1712 N 1st St
- 401 Pecan Blvd
- 000 N 1st St
- 1312 N 5th St
- 125 E Tamarack Ave
- 3100 W Redwood Ave
- 101 W Upas Ave
- 2201 N C St
- 805 N J St
- 707 Nyssa Ave
- 705 Ivy Ave
- 1713 N 7th St
- 613 Sycamore Ave
- 2200 N H St
- 2332 N Peking St
- 220 E Maple Ave
- 216 E Maple Ave
- 225 E Laurel Ave
- 221 E Laurel Ave
- 239 Laurel Ave
- 217 E Laurel Ave
- 225 E Maple Ave
- 221 E Maple Ave
- 208 E Maple Ave
- 217 E Maple Ave
- 209 E Laurel Ave
- 204 E Maple Ave
- 200 E Maple Ave
- 200 E Maple Ave Unit 1
- 205 E Maple Ave
- 224 Nyssa Ave
- 220 E Nyssa Ave
- 216 E Nyssa Ave
- 201 E Maple Ave
- 201 E Laurel Ave
Your Personal Tour Guide
Ask me questions while you tour the home.