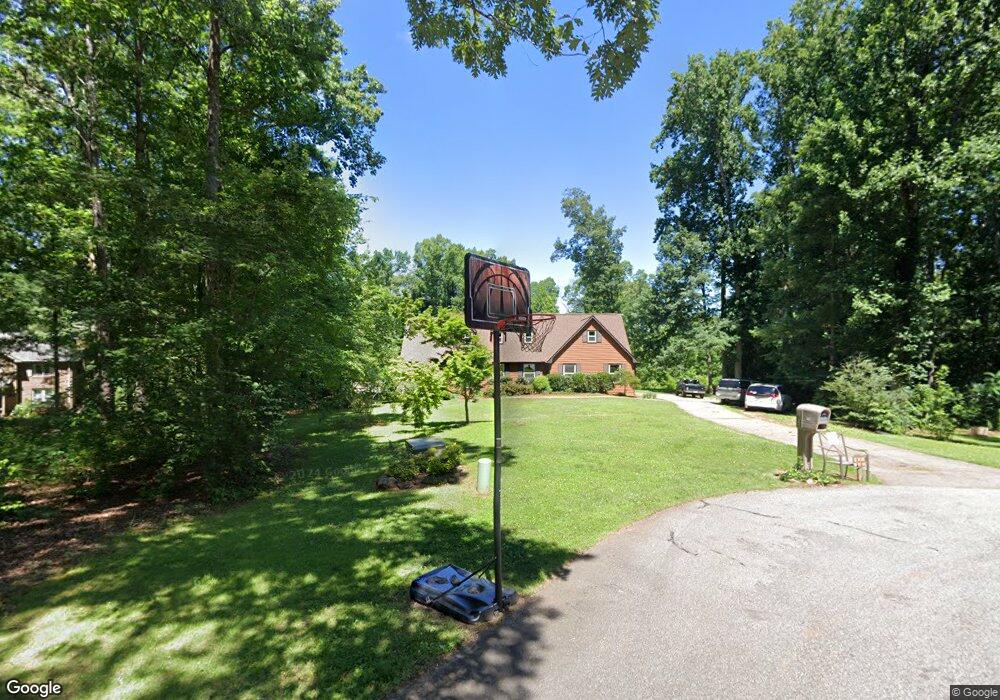
224 Fort Prince Dr Wellford, SC 29385
Estimated Value: $327,000 - $507,000
3
Beds
2
Baths
2,014
Sq Ft
$220/Sq Ft
Est. Value
About This Home
This home is located at 224 Fort Prince Dr, Wellford, SC 29385 and is currently estimated at $443,841, approximately $220 per square foot. 224 Fort Prince Dr is a home located in Spartanburg County with nearby schools including Dorman High School Freshman Campus and Dorman High School.
Ownership History
Date
Name
Owned For
Owner Type
Purchase Details
Closed on
Nov 14, 2014
Sold by
Wyrick Monica E
Bought by
Stevens Heath A and Stevens Leandra R
Current Estimated Value
Home Financials for this Owner
Home Financials are based on the most recent Mortgage that was taken out on this home.
Original Mortgage
$255,102
Outstanding Balance
$196,564
Interest Rate
4.16%
Mortgage Type
New Conventional
Estimated Equity
$247,277
Purchase Details
Closed on
Feb 20, 2009
Sold by
Jones Corey M and Jones Amy L
Bought by
Wyrick Steven D and Wyrick Monica E
Home Financials for this Owner
Home Financials are based on the most recent Mortgage that was taken out on this home.
Original Mortgage
$251,750
Interest Rate
5.03%
Mortgage Type
Purchase Money Mortgage
Purchase Details
Closed on
Nov 30, 2000
Sold by
Patterson Chalers L and Patterson Shelly R
Bought by
Jones Corey M and Riddle Amy L
Create a Home Valuation Report for This Property
The Home Valuation Report is an in-depth analysis detailing your home's value as well as a comparison with similar homes in the area
Home Values in the Area
Average Home Value in this Area
Purchase History
| Date | Buyer | Sale Price | Title Company |
|---|---|---|---|
| Stevens Heath A | $250,000 | -- | |
| Wyrick Steven D | $265,000 | -- | |
| Jones Corey M | $192,000 | -- |
Source: Public Records
Mortgage History
| Date | Status | Borrower | Loan Amount |
|---|---|---|---|
| Open | Stevens Heath A | $255,102 | |
| Previous Owner | Wyrick Steven D | $251,750 |
Source: Public Records
Tax History Compared to Growth
Tax History
| Year | Tax Paid | Tax Assessment Tax Assessment Total Assessment is a certain percentage of the fair market value that is determined by local assessors to be the total taxable value of land and additions on the property. | Land | Improvement |
|---|---|---|---|---|
| 2025 | $1,664 | $10,209 | $1,067 | $9,142 |
| 2024 | $1,664 | $10,210 | $1,224 | $8,986 |
| 2023 | $1,664 | $10,210 | $1,224 | $8,986 |
| 2022 | $1,543 | $8,878 | $829 | $8,049 |
| 2021 | $1,543 | $8,878 | $829 | $8,049 |
| 2020 | $1,519 | $8,878 | $829 | $8,049 |
| 2019 | $1,519 | $8,878 | $829 | $8,049 |
| 2018 | $1,519 | $8,878 | $829 | $8,049 |
| 2017 | $1,308 | $7,720 | $932 | $6,788 |
| 2016 | $1,308 | $7,720 | $932 | $6,788 |
| 2015 | $1,303 | $11,028 | $2,148 | $8,880 |
| 2014 | $1,079 | $6,531 | $611 | $5,920 |
Source: Public Records
Map
Nearby Homes
- 224 Fort Prince Dr
- 228 Fort Prince Dr
- 220 Fort Prince Dr
- 230 Fort Prince Dr
- 216 Fort Prince Dr
- 215 Fort Prince Dr
- 210 Fort Prince Dr
- 209 Fort Prince Ct
- 238 Fort Prince Dr
- 239 Fort Prince Dr
- 0 Fort Prince Ct
- 205 Fort Prince Ct
- 172 Fort Prince Dr
- 6 Fort Prince Ct
- 21111 Brechin Rd
- 2127 Brechin Rd
- 2127 Brechin Rd
- 2111 Brechin Rd Unit CMD 258 Frost C
- 2135 Brechin Rd Unit CMD 239 Crane
- 2107 Brechin Rd Unit Homesite 259 Crane