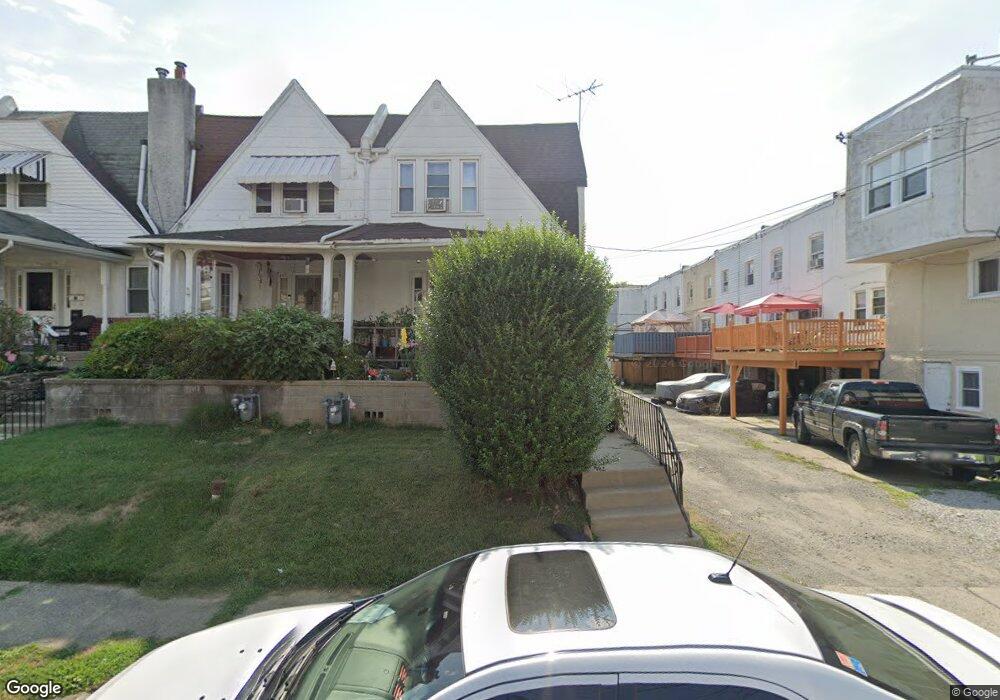
224 Hansell Rd Lansdowne, PA 19050
Estimated Value: $193,047 - $231,000
3
Beds
1
Bath
1,188
Sq Ft
$180/Sq Ft
Est. Value
About This Home
This home is located at 224 Hansell Rd, Lansdowne, PA 19050 and is currently estimated at $214,262, approximately $180 per square foot. 224 Hansell Rd is a home located in Delaware County with nearby schools including East Lansdowne Elementary School, Penn Wood Middle School, and Penn Wood High School - Cypress Street Campus.
Ownership History
Date
Name
Owned For
Owner Type
Purchase Details
Closed on
Jul 7, 2011
Sold by
Secretary Of Housing & Urban Development
Bought by
Bello Scott
Current Estimated Value
Purchase Details
Closed on
Jan 27, 2011
Sold by
Wells Fargo Bank Na
Bought by
Secretary Of Housing & Urban Development
Purchase Details
Closed on
Aug 18, 2010
Sold by
Schultz Jack G
Bought by
Wells Fargo Bank Na
Purchase Details
Closed on
Nov 29, 2000
Sold by
Schlichter Arnold J
Bought by
Schultz Jack G
Home Financials for this Owner
Home Financials are based on the most recent Mortgage that was taken out on this home.
Original Mortgage
$50,460
Interest Rate
7.64%
Mortgage Type
FHA
Purchase Details
Closed on
Dec 1, 1994
Sold by
Irey Roger W and Irey Jacqueline A
Bought by
Schlichter Arnold J
Create a Home Valuation Report for This Property
The Home Valuation Report is an in-depth analysis detailing your home's value as well as a comparison with similar homes in the area
Home Values in the Area
Average Home Value in this Area
Purchase History
| Date | Buyer | Sale Price | Title Company |
|---|---|---|---|
| Bello Scott | $34,100 | None Available | |
| Secretary Of Housing & Urban Development | -- | None Available | |
| Wells Fargo Bank Na | -- | None Available | |
| Schultz Jack G | $50,000 | Commonwealth Land Title Ins | |
| Schlichter Arnold J | $57,900 | -- |
Source: Public Records
Mortgage History
| Date | Status | Borrower | Loan Amount |
|---|---|---|---|
| Previous Owner | Schultz Jack G | $50,460 |
Source: Public Records
Tax History Compared to Growth
Tax History
| Year | Tax Paid | Tax Assessment Tax Assessment Total Assessment is a certain percentage of the fair market value that is determined by local assessors to be the total taxable value of land and additions on the property. | Land | Improvement |
|---|---|---|---|---|
| 2025 | $3,805 | $92,410 | $28,240 | $64,170 |
| 2024 | $3,805 | $92,410 | $28,240 | $64,170 |
| 2023 | $3,627 | $92,410 | $28,240 | $64,170 |
| 2022 | $3,556 | $92,410 | $28,240 | $64,170 |
| 2021 | $5,340 | $92,410 | $28,240 | $64,170 |
| 2020 | $3,452 | $52,640 | $17,180 | $35,460 |
| 2019 | $3,394 | $52,640 | $17,180 | $35,460 |
| 2018 | $3,336 | $52,640 | $0 | $0 |
| 2017 | $3,263 | $52,640 | $0 | $0 |
| 2016 | $295 | $52,640 | $0 | $0 |
| 2015 | $295 | $52,640 | $0 | $0 |
| 2014 | $295 | $52,640 | $0 | $0 |
Source: Public Records
Map
Nearby Homes
- 239 N Maple Ave
- 164 Woodland Ave
- 88 E Essex Ave
- 178 N Union Ave
- 291 N Wycombe Ave
- 315 E Essex Ave
- 317 E Essex Ave
- 319 E Essex Ave
- 209 E Greenwood Ave
- 53 E Essex Ave
- 243 Coverly Rd
- 226 E Greenwood Ave
- 230 Wynnewood Ave
- 75 E Stewart Ave
- 7247 Guilford Rd
- 149 Springton Rd
- 142 Springton Rd
- 127 Sherbrook Blvd
- 404 Croyden Rd
- 339 Huntley Rd
- 222 Hansell Rd
- 220 Hansell Rd
- 154 E Essex Ave
- 152 E Essex Ave
- 156 E Essex Ave
- 218 Hansell Rd
- 150 E Essex Ave
- 223 Wabash Ave
- 144 E Essex Ave
- 216 Hansell Rd
- 221 Wabash Ave
- 146 E Essex Ave
- 219 Wabash Ave
- 214 Hansell Rd
- 217 Wabash Ave
- 215 Wabash Ave
- 142 E Essex Ave
- 213 Wabash Ave
- 223 Hansell Rd
- 221 Hansell Rd