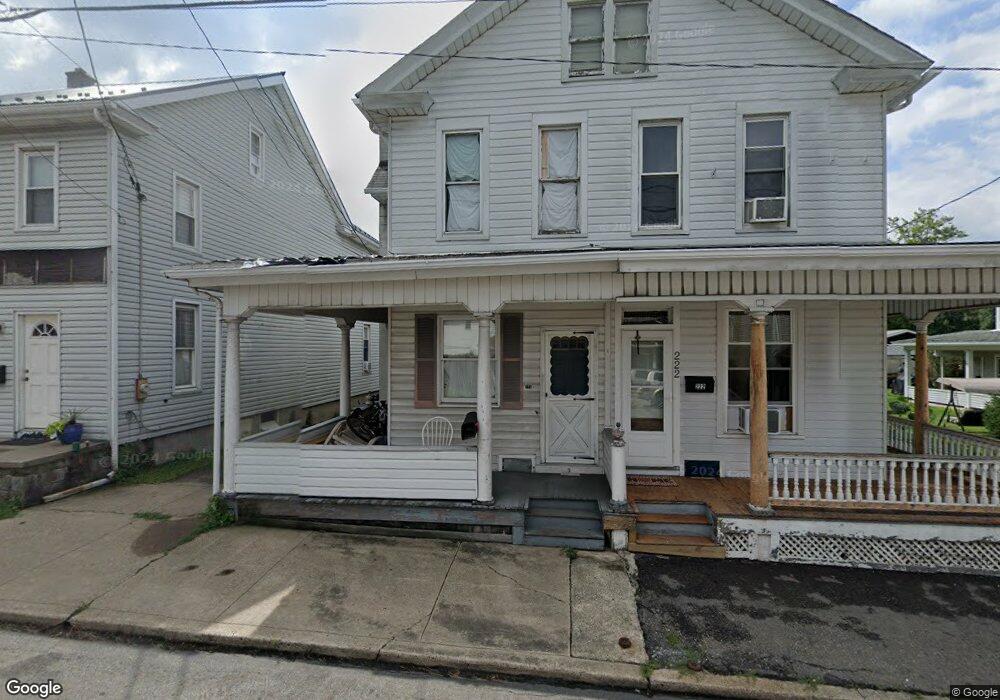
224 Main St Lykens, PA 17048
Estimated Value: $92,000 - $113,000
3
Beds
1
Bath
1,602
Sq Ft
$65/Sq Ft
Est. Value
About This Home
This home is located at 224 Main St, Lykens, PA 17048 and is currently estimated at $104,801, approximately $65 per square foot. 224 Main St is a home located in Dauphin County with nearby schools including Upper Dauphin Area Elementary School, Upper Dauphin Area Middle School, and Upper Dauphin Area High School.
Ownership History
Date
Name
Owned For
Owner Type
Purchase Details
Closed on
Sep 25, 2019
Sold by
Pretopapa Frank and Pretopapa Frank
Bought by
Pretopapa Frank
Current Estimated Value
Purchase Details
Closed on
Sep 25, 2017
Sold by
Home Opportunity
Bought by
Pretopapa Frank
Purchase Details
Closed on
Apr 17, 2013
Sold by
Transportation Alliance Bank
Bought by
Home Opportunity Llc
Purchase Details
Closed on
Jul 13, 2012
Sold by
Acp 1 Llc
Bought by
Transportation Alliance Bank
Purchase Details
Closed on
Jan 13, 2011
Sold by
Lotwick Sheriff J R and Scheib Jerry
Bought by
Federal National Mortgage Association
Purchase Details
Closed on
Mar 29, 2007
Sold by
Bopp Barry J
Bought by
Scheib Jerry R
Home Financials for this Owner
Home Financials are based on the most recent Mortgage that was taken out on this home.
Original Mortgage
$44,900
Interest Rate
6.19%
Mortgage Type
New Conventional
Create a Home Valuation Report for This Property
The Home Valuation Report is an in-depth analysis detailing your home's value as well as a comparison with similar homes in the area
Home Values in the Area
Average Home Value in this Area
Purchase History
| Date | Buyer | Sale Price | Title Company |
|---|---|---|---|
| Pretopapa Frank | -- | None Available | |
| Pretopapa Frank | $5,418 | None Available | |
| Home Opportunity Llc | -- | -- | |
| Transportation Alliance Bank | -- | -- | |
| Federal National Mortgage Association | -- | -- | |
| Scheib Jerry R | $44,900 | -- |
Source: Public Records
Mortgage History
| Date | Status | Borrower | Loan Amount |
|---|---|---|---|
| Previous Owner | Scheib Jerry R | $44,900 |
Source: Public Records
Tax History Compared to Growth
Tax History
| Year | Tax Paid | Tax Assessment Tax Assessment Total Assessment is a certain percentage of the fair market value that is determined by local assessors to be the total taxable value of land and additions on the property. | Land | Improvement |
|---|---|---|---|---|
| 2025 | $1,370 | $39,600 | $6,800 | $32,800 |
| 2024 | $1,282 | $39,600 | $6,800 | $32,800 |
| 2023 | $1,261 | $39,600 | $6,800 | $32,800 |
| 2022 | $1,238 | $39,600 | $6,800 | $32,800 |
| 2021 | $1,238 | $39,600 | $6,800 | $32,800 |
| 2020 | $1,238 | $39,600 | $6,800 | $32,800 |
| 2019 | $1,229 | $39,600 | $6,800 | $32,800 |
| 2018 | $1,195 | $39,600 | $6,800 | $32,800 |
| 2017 | $1,185 | $39,600 | $6,800 | $32,800 |
| 2016 | $0 | $39,600 | $6,800 | $32,800 |
| 2015 | -- | $39,600 | $6,800 | $32,800 |
| 2014 | -- | $39,600 | $6,800 | $32,800 |
Source: Public Records
Map
Nearby Homes