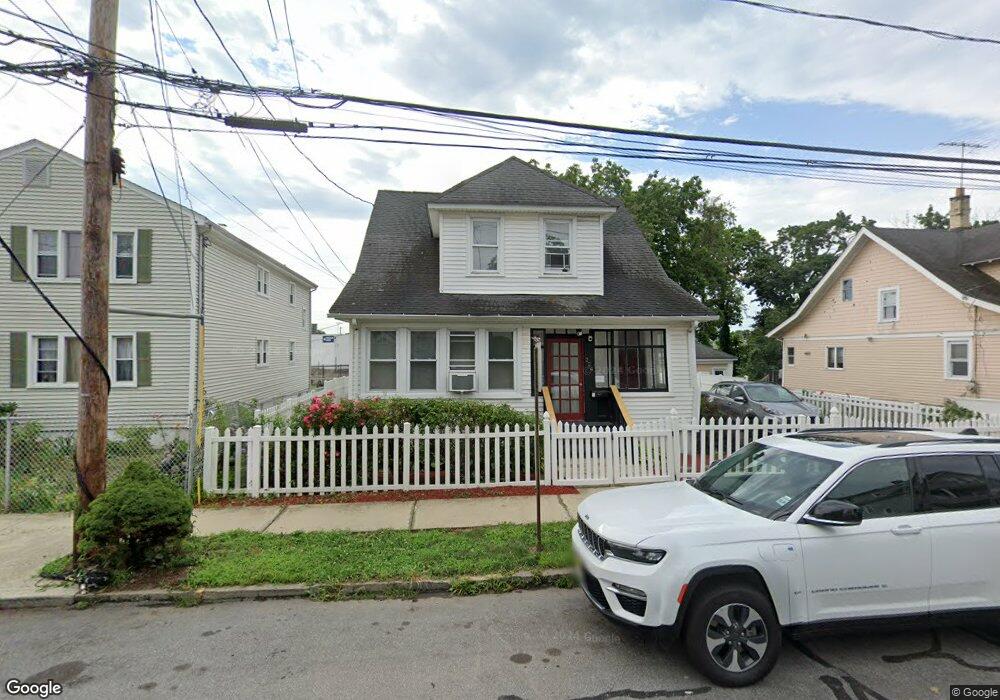
224 Monroe St Unit 2 Bridgeport, CT 06605
Black Rock NeighborhoodEstimated Value: $455,074 - $574,000
2
Beds
1
Bath
1,391
Sq Ft
$381/Sq Ft
Est. Value
About This Home
This home is located at 224 Monroe St Unit 2, Bridgeport, CT 06605 and is currently estimated at $529,769, approximately $380 per square foot. 224 Monroe St Unit 2 is a home located in Fairfield County with nearby schools including Bassick High School, Park City Prep Charter School, and Great Oaks Charter School Bridgeport.
Ownership History
Date
Name
Owned For
Owner Type
Purchase Details
Closed on
Jun 21, 2010
Sold by
Candev Partners Llc
Bought by
Marriott Anthony R and Marriott Oluwatosin
Current Estimated Value
Home Financials for this Owner
Home Financials are based on the most recent Mortgage that was taken out on this home.
Original Mortgage
$226,775
Outstanding Balance
$151,264
Interest Rate
5.03%
Estimated Equity
$378,505
Purchase Details
Closed on
Nov 5, 2009
Sold by
Camelot Dev Llc
Bought by
Camelot Dev Partners L
Purchase Details
Closed on
Sep 23, 2009
Sold by
Us Bk
Bought by
Camelot Dev Llc
Purchase Details
Closed on
Aug 26, 2008
Sold by
Berge Felix
Bought by
Option One Mortgage Co
Purchase Details
Closed on
Feb 3, 2005
Sold by
Kucej John
Bought by
Berigute Felix
Create a Home Valuation Report for This Property
The Home Valuation Report is an in-depth analysis detailing your home's value as well as a comparison with similar homes in the area
Home Values in the Area
Average Home Value in this Area
Purchase History
| Date | Buyer | Sale Price | Title Company |
|---|---|---|---|
| Marriott Anthony R | $235,000 | -- | |
| Marriott Anthony R | $235,000 | -- | |
| Camelot Dev Partners L | -- | -- | |
| Camelot Dev Partners L | -- | -- | |
| Camelot Dev Llc | $60,000 | -- | |
| Camelot Dev Llc | $60,000 | -- | |
| Option One Mortgage Co | -- | -- | |
| Option One Mortgage Co | -- | -- | |
| Berigute Felix | $246,000 | -- | |
| Berigute Felix | $246,000 | -- |
Source: Public Records
Mortgage History
| Date | Status | Borrower | Loan Amount |
|---|---|---|---|
| Open | Berigute Felix | $226,775 | |
| Closed | Berigute Felix | $226,775 |
Source: Public Records
Tax History Compared to Growth
Tax History
| Year | Tax Paid | Tax Assessment Tax Assessment Total Assessment is a certain percentage of the fair market value that is determined by local assessors to be the total taxable value of land and additions on the property. | Land | Improvement |
|---|---|---|---|---|
| 2025 | $7,431 | $171,020 | $78,230 | $92,790 |
| 2024 | $7,431 | $171,020 | $78,230 | $92,790 |
| 2023 | $7,431 | $171,020 | $78,230 | $92,790 |
| 2022 | $7,431 | $171,020 | $78,230 | $92,790 |
| 2021 | $7,431 | $171,020 | $78,230 | $92,790 |
| 2020 | $6,018 | $111,460 | $39,500 | $71,960 |
| 2019 | $6,018 | $111,460 | $39,500 | $71,960 |
| 2018 | $6,060 | $111,460 | $39,500 | $71,960 |
| 2017 | $6,060 | $111,460 | $39,500 | $71,960 |
| 2016 | $6,060 | $111,460 | $39,500 | $71,960 |
| 2015 | $5,679 | $134,580 | $40,630 | $93,950 |
| 2014 | $5,679 | $134,580 | $40,630 | $93,950 |
Source: Public Records
Map
Nearby Homes
- 188 Monroe St Unit 190
- 25 Whittier St
- 31 Whittier St
- 82 Waldorf Ave
- 167 Scofield Ave
- 37 Rowsley St Unit 6
- 26 Rowsley St Unit 3
- 554 Brewster St Unit 4
- 855 Brewster St Unit 857
- 95 Bedford Ave
- 317 Brewster St
- 85 Ash St
- 39 Jetland Place Unit 41
- 165 Bennett St
- 75 Homestead Ave Unit 77
- 118 Berwick Ave
- 105 Fox St Unit 107
- 130 Brentwood Ave
- 145 Brentwood Ave
- 132 Gilman St
- 224 Monroe St
- 234 Monroe St Unit 236
- 218 Monroe St
- 225 Monroe St Unit 227
- 215 Monroe St Unit 217
- 231 Monroe St
- 233 Monroe St Unit 235
- 233 Monroe St Unit 2
- 233 Monroe St Unit 3
- 233 Monroe St Unit 1
- 235 Monroe St
- 204 Monroe St Unit 206
- 200 Monroe St
- 198 Monroe St
- 243 Monroe St Unit C-4
- 243 Monroe St Unit C-1
- 243 Monroe St Unit A-3
- 243 Monroe St Unit A-2
- 243 Monroe St
- 243 Monroe St Unit 2-C