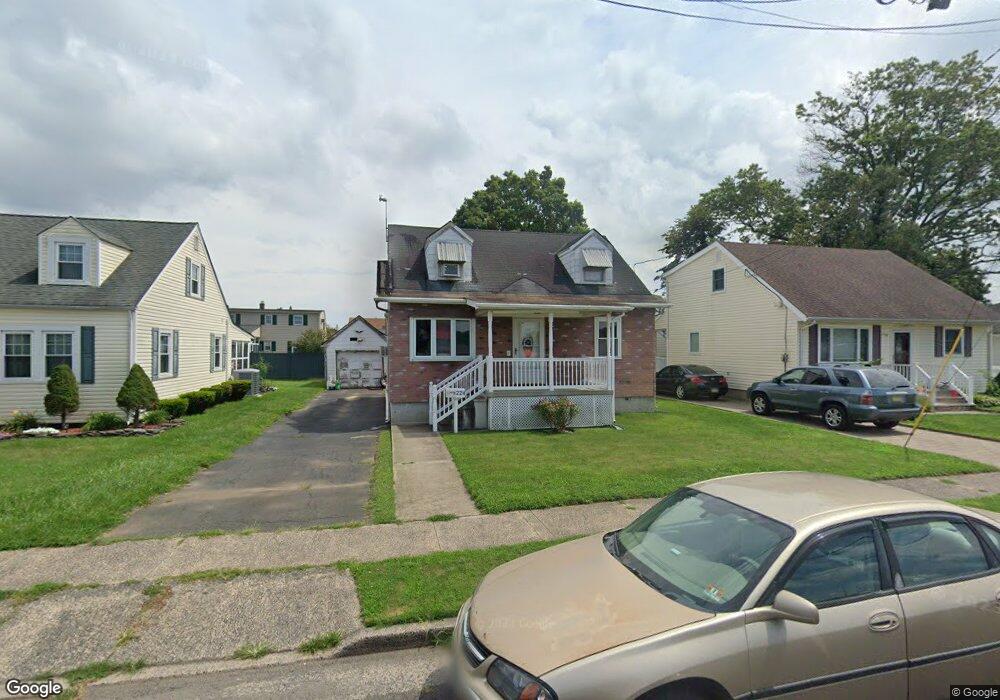
224 N 10th Ave Manville, NJ 08835
Estimated Value: $361,555 - $437,000
--
Bed
--
Bath
1,160
Sq Ft
$347/Sq Ft
Est. Value
About This Home
This home is located at 224 N 10th Ave, Manville, NJ 08835 and is currently estimated at $402,889, approximately $347 per square foot. 224 N 10th Ave is a home located in Somerset County with nearby schools including Weston Elementary School, Roosevelt School, and Alexander Batcho Intermediate School (ABIS).
Ownership History
Date
Name
Owned For
Owner Type
Purchase Details
Closed on
Aug 23, 2022
Sold by
Madden Arthur F and Madden Elizabeth
Bought by
Madden Arthur F and Madden Sandra L
Current Estimated Value
Purchase Details
Closed on
Mar 31, 1997
Sold by
Mrofka Michele
Bought by
Madden Arthur and Madden Elizabeth
Home Financials for this Owner
Home Financials are based on the most recent Mortgage that was taken out on this home.
Original Mortgage
$104,000
Interest Rate
7.5%
Create a Home Valuation Report for This Property
The Home Valuation Report is an in-depth analysis detailing your home's value as well as a comparison with similar homes in the area
Home Values in the Area
Average Home Value in this Area
Purchase History
| Date | Buyer | Sale Price | Title Company |
|---|---|---|---|
| Madden Arthur F | -- | -- | |
| Madden Arthur | $115,000 | -- |
Source: Public Records
Mortgage History
| Date | Status | Borrower | Loan Amount |
|---|---|---|---|
| Previous Owner | Madden Arthur | $104,000 |
Source: Public Records
Tax History Compared to Growth
Tax History
| Year | Tax Paid | Tax Assessment Tax Assessment Total Assessment is a certain percentage of the fair market value that is determined by local assessors to be the total taxable value of land and additions on the property. | Land | Improvement |
|---|---|---|---|---|
| 2025 | $6,503 | $319,300 | $219,500 | $99,800 |
| 2024 | $6,503 | $288,900 | $191,000 | $97,900 |
| 2023 | $6,791 | $282,500 | $172,000 | $110,500 |
| 2022 | $6,519 | $249,200 | $143,500 | $105,700 |
| 2021 | $6,192 | $209,400 | $115,000 | $94,400 |
| 2020 | $6,065 | $192,600 | $100,700 | $91,900 |
| 2019 | $6,044 | $185,000 | $100,700 | $84,300 |
| 2018 | $5,660 | $173,100 | $86,500 | $86,600 |
| 2017 | $5,464 | $170,000 | $81,700 | $88,300 |
| 2016 | $5,267 | $170,000 | $81,700 | $88,300 |
| 2015 | $6,086 | $251,800 | $153,900 | $97,900 |
| 2014 | $5,965 | $251,800 | $153,900 | $97,900 |
Source: Public Records
Map
Nearby Homes