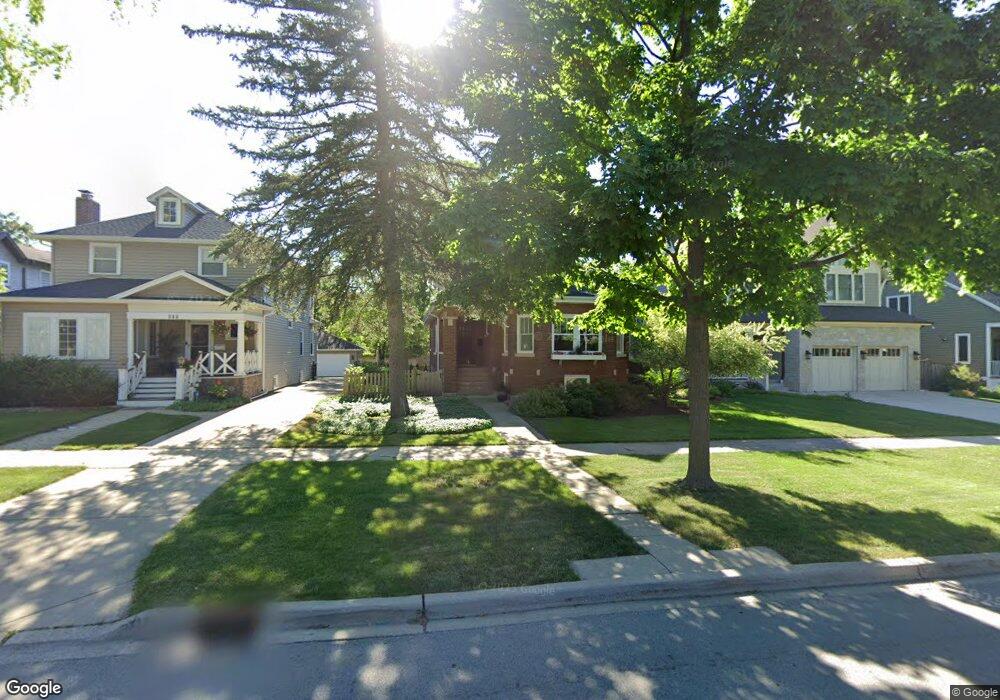
224 N Maple Ave Elmhurst, IL 60126
Estimated Value: $708,135 - $976,000
Studio
--
Bath
2,446
Sq Ft
$332/Sq Ft
Est. Value
About This Home
This home is located at 224 N Maple Ave, Elmhurst, IL 60126 and is currently estimated at $811,784, approximately $331 per square foot. 224 N Maple Ave is a home located in DuPage County with nearby schools including Hawthorne Elementary School, Sandburg Middle School, and York Community High School.
Ownership History
Date
Name
Owned For
Owner Type
Purchase Details
Closed on
Jun 16, 1999
Sold by
Whitenack Michael D and Whitenack Daniela M
Bought by
Devereux Daniel J and Devereux Chris
Current Estimated Value
Home Financials for this Owner
Home Financials are based on the most recent Mortgage that was taken out on this home.
Original Mortgage
$198,500
Outstanding Balance
$52,394
Interest Rate
7.06%
Estimated Equity
$759,390
Purchase Details
Closed on
Jul 15, 1994
Sold by
Thon Erwin W
Bought by
Whitenack Michael D and Whitenack Daniela M
Home Financials for this Owner
Home Financials are based on the most recent Mortgage that was taken out on this home.
Original Mortgage
$161,000
Interest Rate
8.41%
Create a Home Valuation Report for This Property
The Home Valuation Report is an in-depth analysis detailing your home's value as well as a comparison with similar homes in the area
Home Values in the Area
Average Home Value in this Area
Purchase History
| Date | Buyer | Sale Price | Title Company |
|---|---|---|---|
| Devereux Daniel J | $282,000 | -- | |
| Whitenack Michael D | $215,000 | Attorneys Title Guaranty Fun |
Source: Public Records
Mortgage History
| Date | Status | Borrower | Loan Amount |
|---|---|---|---|
| Open | Devereux Daniel J | $198,500 | |
| Previous Owner | Whitenack Michael D | $161,000 |
Source: Public Records
Tax History
| Year | Tax Paid | Tax Assessment Tax Assessment Total Assessment is a certain percentage of the fair market value that is determined by local assessors to be the total taxable value of land and additions on the property. | Land | Improvement |
|---|---|---|---|---|
| 2024 | $11,636 | $201,075 | $88,080 | $112,995 |
| 2023 | $10,803 | $185,940 | $81,450 | $104,490 |
| 2022 | $10,475 | $178,750 | $78,300 | $100,450 |
| 2021 | $10,216 | $174,300 | $76,350 | $97,950 |
| 2020 | $9,821 | $170,480 | $74,680 | $95,800 |
| 2019 | $9,614 | $162,080 | $71,000 | $91,080 |
| 2018 | $9,546 | $160,090 | $67,210 | $92,880 |
| 2017 | $9,338 | $152,560 | $64,050 | $88,510 |
| 2016 | $9,142 | $143,720 | $60,340 | $83,380 |
| 2015 | $9,052 | $133,890 | $56,210 | $77,680 |
| 2014 | $10,160 | $137,840 | $44,620 | $93,220 |
| 2013 | $10,049 | $139,780 | $45,250 | $94,530 |
Source: Public Records
Map
Nearby Homes
- 142 W 3rd St
- 254 N Addison Ave
- 258 N Addison Ave
- 256 N Addison Ave
- 260 N Addison Ave
- 210 N Addison Ave Unit 301N
- 195 N Addison Ave Unit PH03
- 275 W North Ave
- 147 N Myrtle Ave
- 110 N Elm Ave
- 196 N Walnut St
- 108 Evergreen Ave
- 104 Evergreen Ave
- 145 N Walnut St
- 146 N Walnut St
- 105 S Cottage Hill Ave Unit 304
- 105 S Cottage Hill Ave Unit 206
- 105 S Cottage Hill Ave Unit 204
- 365 N Walnut St
- 270 W Fremont Ave
- 230 N Maple Ave
- 222 N Maple Ave
- 218 N Maple Ave
- 240 N Maple Ave
- 242 N Maple Ave
- 231 N Maple Ave
- 221 N Maple Ave
- 225 N Elm Ave
- 229 N Elm Ave
- 239 N Elm Ave
- 244 N Maple Ave
- 225 N Maple Ave
- 239 N Maple Ave
- 241 N Elm Ave
- 235 N Maple Ave
- 219 N Maple Ave
- 210 N Maple Ave
- 221 N Elm Ave
- 250 N Maple Ave
- 243 N Elm Ave
Your Personal Tour Guide
Ask me questions while you tour the home.