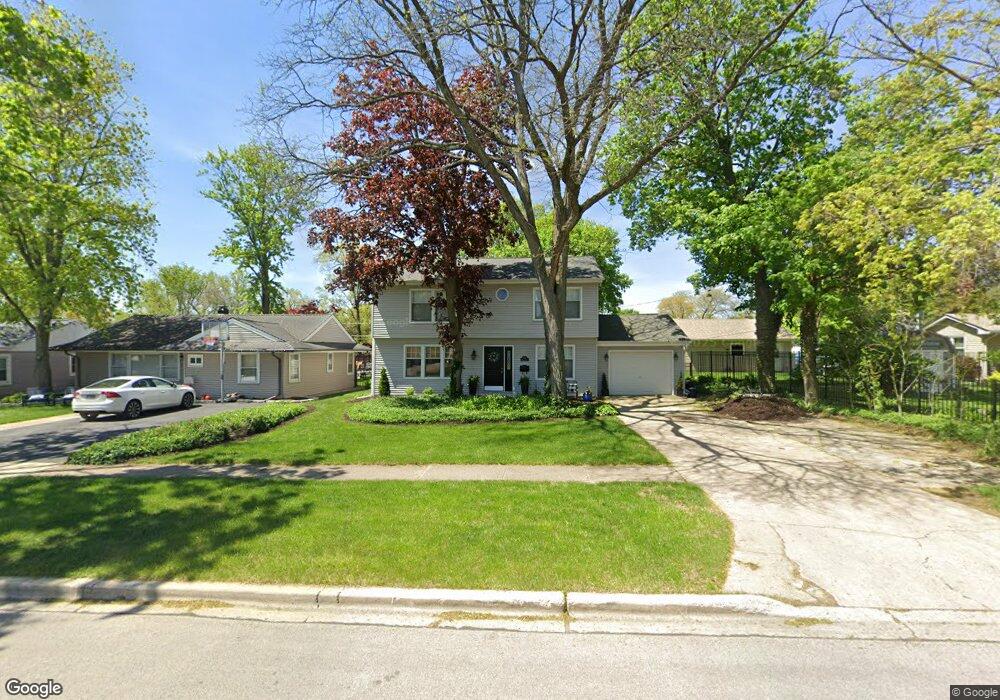
224 N Morgan Ave Wheaton, IL 60187
West Wheaton NeighborhoodEstimated Value: $389,000 - $486,000
4
Beds
2
Baths
2,002
Sq Ft
$219/Sq Ft
Est. Value
About This Home
This home is located at 224 N Morgan Ave, Wheaton, IL 60187 and is currently estimated at $438,332, approximately $218 per square foot. 224 N Morgan Ave is a home located in DuPage County with nearby schools including Emerson Elementary School, Monroe Middle School, and Wheaton North High School.
Ownership History
Date
Name
Owned For
Owner Type
Purchase Details
Closed on
Mar 17, 2009
Sold by
Fannie Mae
Bought by
Impola Larry and Impola Ann
Current Estimated Value
Home Financials for this Owner
Home Financials are based on the most recent Mortgage that was taken out on this home.
Original Mortgage
$214,051
Outstanding Balance
$136,756
Interest Rate
5.22%
Mortgage Type
FHA
Estimated Equity
$301,576
Purchase Details
Closed on
Nov 18, 2008
Sold by
Blanchard Mark S
Bought by
Federal National Mortgage Association
Purchase Details
Closed on
Aug 31, 1999
Sold by
Spandikow Donna R and Donna R Spandikow Trust
Bought by
Blanchard Mark S and Blanchard Rachel J
Home Financials for this Owner
Home Financials are based on the most recent Mortgage that was taken out on this home.
Original Mortgage
$172,800
Interest Rate
10.2%
Purchase Details
Closed on
Mar 26, 1999
Sold by
Chase Manhattan Mtg Bank Usa Na
Bought by
Spandikow Donna R
Create a Home Valuation Report for This Property
The Home Valuation Report is an in-depth analysis detailing your home's value as well as a comparison with similar homes in the area
Home Values in the Area
Average Home Value in this Area
Purchase History
| Date | Buyer | Sale Price | Title Company |
|---|---|---|---|
| Impola Larry | -- | Git | |
| Federal National Mortgage Association | -- | None Available | |
| Blanchard Mark S | $192,000 | -- | |
| Spandikow Donna R | $81,000 | -- |
Source: Public Records
Mortgage History
| Date | Status | Borrower | Loan Amount |
|---|---|---|---|
| Open | Impola Larry | $214,051 | |
| Previous Owner | Blanchard Mark S | $172,800 |
Source: Public Records
Tax History
| Year | Tax Paid | Tax Assessment Tax Assessment Total Assessment is a certain percentage of the fair market value that is determined by local assessors to be the total taxable value of land and additions on the property. | Land | Improvement |
|---|---|---|---|---|
| 2024 | $7,506 | $127,424 | $30,441 | $96,983 |
| 2023 | $7,201 | $114,560 | $28,020 | $86,540 |
| 2022 | $7,083 | $108,270 | $26,480 | $81,790 |
| 2021 | $7,056 | $105,700 | $25,850 | $79,850 |
| 2020 | $7,034 | $104,720 | $25,610 | $79,110 |
| 2019 | $6,869 | $101,950 | $24,930 | $77,020 |
| 2018 | $6,524 | $96,070 | $23,490 | $72,580 |
| 2017 | $6,421 | $92,520 | $22,620 | $69,900 |
| 2016 | $6,331 | $88,830 | $21,720 | $67,110 |
| 2015 | $6,276 | $84,740 | $20,720 | $64,020 |
| 2014 | $6,902 | $91,120 | $19,060 | $72,060 |
| 2013 | $6,725 | $91,400 | $19,120 | $72,280 |
Source: Public Records
Map
Nearby Homes
- 107 N Pierce Ave
- 615 Polo Dr
- 833 Parkside Dr
- 1478 Timber Trail Unit 15C
- 1474 Timber Trail Unit D
- 0N049 Page St
- 405 W Front St Unit 3207
- 0N105 Lot 1 Nepil Ave
- 0N105 Lot 2 Nepil Ave
- 536 W Evergreen St
- 1110 S Gables Blvd
- 522 S West St
- 26W548 Prairie Ave
- 1974 Wexford Cir Unit 123
- 1021 Greenwood Dr
- 520 S Wheaton Ave
- 27W073 Jewell Rd
- 2043 Spring Green Dr
- 1028 Lodalia Ct
- Lot 1 Foothill Dr
- 218 N Morgan Ave
- 214 N Morgan Ave
- 234 N Morgan Ave
- 1506 Manchester Rd
- 1510 Manchester Rd
- 210 N Morgan Ave
- 219 N Pierce Ave
- 215 N Pierce Ave
- 219 N Morgan Ave
- 1516 Manchester Rd
- 223 N Morgan Ave
- 206 N Morgan Ave
- 227 N Morgan Ave
- 235 N Morgan Ave
- 1520 Manchester Rd
- 211 N Pierce Ave
- 213 N Morgan Ave
- 211 N Morgan Ave
- 202 N Morgan Ave
- 207 N Pierce Ave
Your Personal Tour Guide
Ask me questions while you tour the home.