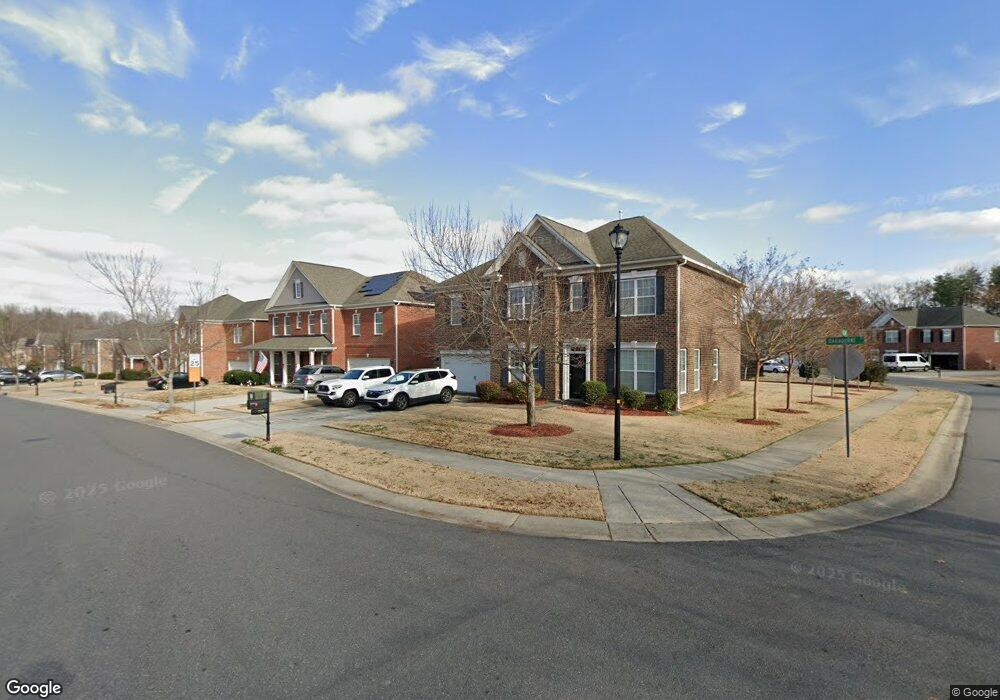
224 Oakbourne Ln Rock Hill, SC 29732
Estimated Value: $456,000 - $631,000
4
Beds
3
Baths
2,912
Sq Ft
$176/Sq Ft
Est. Value
About This Home
This home is located at 224 Oakbourne Ln, Rock Hill, SC 29732 and is currently estimated at $512,886, approximately $176 per square foot. 224 Oakbourne Ln is a home located in York County with nearby schools including Mount Gallant Elementary School, Dutchman Creek Middle School, and Northwestern High School.
Ownership History
Date
Name
Owned For
Owner Type
Purchase Details
Closed on
Apr 9, 2015
Sold by
Khatri Ramesh and Khatri Santosh
Bought by
May Ryan O
Current Estimated Value
Home Financials for this Owner
Home Financials are based on the most recent Mortgage that was taken out on this home.
Original Mortgage
$228,000
Outstanding Balance
$176,849
Interest Rate
3.95%
Mortgage Type
New Conventional
Estimated Equity
$336,037
Purchase Details
Closed on
Mar 24, 2011
Sold by
Live Well Homes Llc
Bought by
Khatri Ramesh and Khatri Santosh
Home Financials for this Owner
Home Financials are based on the most recent Mortgage that was taken out on this home.
Original Mortgage
$120,000
Interest Rate
4.92%
Mortgage Type
New Conventional
Purchase Details
Closed on
Nov 18, 2010
Sold by
Riverwood Associates Llc
Bought by
Live Well Homes Llc
Home Financials for this Owner
Home Financials are based on the most recent Mortgage that was taken out on this home.
Original Mortgage
$145,137
Interest Rate
4.3%
Mortgage Type
Construction
Create a Home Valuation Report for This Property
The Home Valuation Report is an in-depth analysis detailing your home's value as well as a comparison with similar homes in the area
Home Values in the Area
Average Home Value in this Area
Purchase History
| Date | Buyer | Sale Price | Title Company |
|---|---|---|---|
| May Ryan O | $240,000 | -- | |
| Khatri Ramesh | $175,000 | -- | |
| Live Well Homes Llc | $130,000 | -- |
Source: Public Records
Mortgage History
| Date | Status | Borrower | Loan Amount |
|---|---|---|---|
| Open | May Ryan O | $228,000 | |
| Previous Owner | Khatri Ramesh | $120,000 | |
| Previous Owner | Live Well Homes Llc | $145,137 |
Source: Public Records
Tax History Compared to Growth
Tax History
| Year | Tax Paid | Tax Assessment Tax Assessment Total Assessment is a certain percentage of the fair market value that is determined by local assessors to be the total taxable value of land and additions on the property. | Land | Improvement |
|---|---|---|---|---|
| 2024 | $1,427 | $10,189 | $1,116 | $9,073 |
| 2023 | $1,464 | $10,189 | $1,116 | $9,073 |
| 2022 | $1,469 | $10,189 | $1,116 | $9,073 |
| 2021 | -- | $10,189 | $1,116 | $9,073 |
| 2020 | $1,466 | $10,189 | $0 | $0 |
| 2019 | $1,335 | $8,860 | $0 | $0 |
| 2018 | $1,327 | $8,860 | $0 | $0 |
| 2017 | $1,251 | $8,860 | $0 | $0 |
| 2016 | $1,227 | $8,860 | $0 | $0 |
| 2014 | $896 | $11,790 | $1,800 | $9,990 |
| 2013 | $896 | $10,290 | $3,000 | $7,290 |
Source: Public Records
Map
Nearby Homes
- 716 Millstream Dr
- 704 Millstream Dr
- 4222 Mount Gallant Rd
- 4026 Palmetto Dr
- 1620 Enon Ct Unit 9
- 4445 Homestead Rd
- 808 Painted Lady Ct
- 1623 E Lakewood Dr
- 1593 Bloomfield Rd
- Lake Wylie Dr
- Lot 6 Lake Wylie Dr
- Lot 5 Lake Wylie Dr
- Lot 4 Lake Wylie Dr
- Lot 3 Lake Wylie Dr
- 1947 Fairhill Cir
- Lot 2 Lake Wylie Dr
- Lot 1 Lake Wylie Dr
- 1162 Allison Bluff Trail
- 1895 Forest Lake Dr
- 3007 Point Clear Dr
- 236 Oakbourne Ln
- 237 Oakbourne Ln Unit 44
- 248 Oakbourne Ln
- 512 Millstream Dr
- 225 Oakbourne Ln
- 524 Millstream Dr
- 561 Millstream Dr Unit 60
- 313 Crannog Way
- 260 Oakbourne Ln
- 585 Millstream Dr
- 536 Millstream Dr
- 597 Millstream Dr
- 325 Crannog Way
- 272 Oakbourne Ln
- 548 Millstream Dr
- 273 Oakbourne Ln
- 336 Crannog Way
- 609 Millstream Dr
- 337 Crannog Way
- 560 Millstream Dr