
Seller's Agent in 2025
Tania Griffin
Cadence Realty & Property Services
(706) 518-9577
11 Total Sales
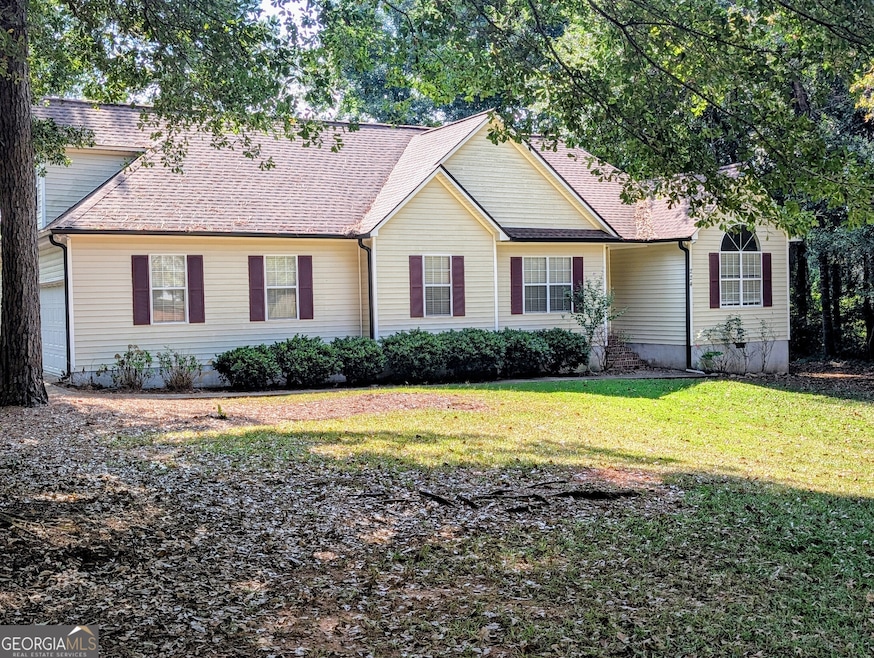
Welcome to this lovely 3 bedroom 2 bath home nestled in the friendly community of LaGrange. This home also features a bonus room above the garage, perfect for a home office, game room or an additional bedroom space. This property has a split floor plan with a large primary bedroom and bathroom, along with an open concept living/dining area. This property is located close to shopping, dining and downtown LaGrange.
Last Agent to Sell the Property
Cadence Realty & Property Services License #281334 Listed on: 09/20/2025
| Date | Type | Sale Price | Title Company |
|---|---|---|---|
| Warranty Deed | $200,000 | -- | |
| Deed | $114,900 | -- | |
| Warranty Deed | $150,000 | -- | |
| Quit Claim Deed | -- | -- | |
| Deed | -- | -- | |
| Warranty Deed | $135,000 | -- | |
| Deed | -- | -- |
| Date | Status | Loan Amount | Loan Type |
|---|---|---|---|
| Open | $150,000 | Purchase Money Mortgage | |
| Previous Owner | $75,000 | New Conventional |
| Date | Event | Price | List to Sale | Price per Sq Ft |
|---|---|---|---|---|
| 12/15/2025 12/15/25 | Sold | $200,000 | -16.6% | $100 / Sq Ft |
| 11/13/2025 11/13/25 | Pending | -- | -- | -- |
| 11/01/2025 11/01/25 | Price Changed | $239,900 | -7.7% | $120 / Sq Ft |
| 09/20/2025 09/20/25 | For Sale | $259,900 | -- | $129 / Sq Ft |
| Year | Tax Paid | Tax Assessment Tax Assessment Total Assessment is a certain percentage of the fair market value that is determined by local assessors to be the total taxable value of land and additions on the property. | Land | Improvement |
|---|---|---|---|---|
| 2025 | $1,964 | $106,200 | $14,000 | $92,200 |
| 2024 | $1,709 | $91,720 | $14,000 | $77,720 |
| 2023 | $2,275 | $91,240 | $14,000 | $77,240 |
| 2022 | $1,924 | $76,680 | $10,000 | $66,680 |
| 2021 | $1,824 | $68,240 | $8,000 | $60,240 |
| 2020 | $1,824 | $68,240 | $8,000 | $60,240 |
| 2019 | $1,657 | $62,680 | $8,000 | $54,680 |
| 2018 | $1,677 | $63,360 | $10,000 | $53,360 |
| 2017 | $1,677 | $63,360 | $10,000 | $53,360 |
| 2016 | $1,651 | $62,489 | $10,000 | $52,489 |
| 2015 | $1,651 | $62,489 | $10,000 | $52,489 |
| 2014 | $1,568 | $59,726 | $10,000 | $49,726 |
| 2013 | -- | $60,138 | $10,000 | $50,138 |
Seller's Agent in 2025
Tania Griffin
Cadence Realty & Property Services
(706) 518-9577
11 Total Sales
Buyer's Agent in 2025
Mark Hubbard
Go Realty
(706) 668-7253
341 Total Sales
Source: Georgia MLS
MLS Number: 10610534
APN: 049-4C-000-215
Disclaimer: Certain information contained herein is derived from information provided by parties other than Homes.com. All information provided is deemed reliable, but is not guaranteed to be accurate and should be independently verified.
![]() The data relating to real estate for sale on this web site comes in part from the Broker Reciprocity Program of Georgia MLS. Real estate listings held by brokerage firms other than Redfin are marked with the Broker Reciprocity logo and detailed information about them includes the name of the listing brokers. Information deemed reliable but not guaranteed. Copyright 2026 Georgia MLS. All rights reserved.
The data relating to real estate for sale on this web site comes in part from the Broker Reciprocity Program of Georgia MLS. Real estate listings held by brokerage firms other than Redfin are marked with the Broker Reciprocity logo and detailed information about them includes the name of the listing brokers. Information deemed reliable but not guaranteed. Copyright 2026 Georgia MLS. All rights reserved.
Ask me questions while you tour the home.