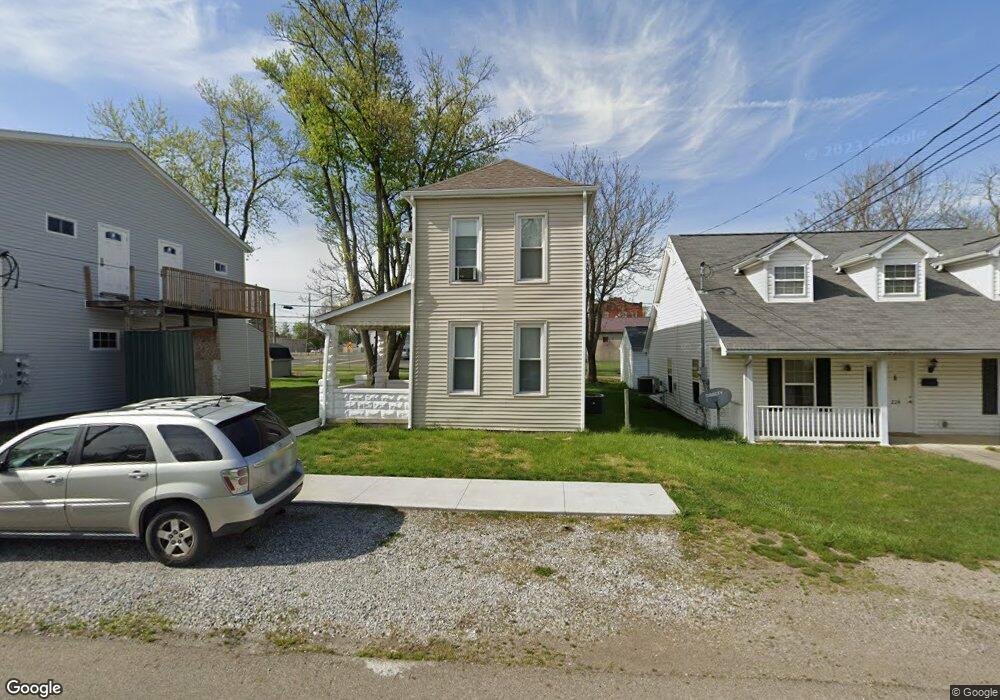
224 Race St Newark, OH 43055
Estimated Value: $159,000 - $183,000
3
Beds
1
Bath
1,332
Sq Ft
$125/Sq Ft
Est. Value
About This Home
This home is located at 224 Race St, Newark, OH 43055 and is currently estimated at $166,090, approximately $124 per square foot. 224 Race St is a home located in Licking County with nearby schools including Ben Franklin Elementary School, Heritage Middle School, and Newark High School.
Ownership History
Date
Name
Owned For
Owner Type
Purchase Details
Closed on
Sep 9, 2021
Sold by
Bubb Ryan T
Bought by
Tasf Enterprises Llc
Current Estimated Value
Purchase Details
Closed on
Jan 17, 2006
Sold by
Mesa Park Apartments Llc
Bought by
Bubb Ryan T
Purchase Details
Closed on
Dec 28, 2005
Sold by
Jonathan Properties Ltd
Bought by
Mesa Park Apartments Llc
Purchase Details
Closed on
Dec 22, 2005
Sold by
Union Savings Bank Of Hamilton
Bought by
Jonathan Properties Ltd
Purchase Details
Closed on
Feb 28, 2005
Sold by
Evans D Christopher
Bought by
Union Savings Bank
Purchase Details
Closed on
Aug 10, 1999
Sold by
Hendrickson Bonnie G
Bought by
Evans David C
Home Financials for this Owner
Home Financials are based on the most recent Mortgage that was taken out on this home.
Original Mortgage
$31,200
Interest Rate
7.5%
Mortgage Type
New Conventional
Create a Home Valuation Report for This Property
The Home Valuation Report is an in-depth analysis detailing your home's value as well as a comparison with similar homes in the area
Home Values in the Area
Average Home Value in this Area
Purchase History
| Date | Buyer | Sale Price | Title Company |
|---|---|---|---|
| Tasf Enterprises Llc | $115,000 | None Available | |
| Bubb Ryan T | -- | None Available | |
| Mesa Park Apartments Llc | $25,000 | -- | |
| Jonathan Properties Ltd | $15,000 | Tri Star Title Agency Inc | |
| Union Savings Bank | $25,000 | -- | |
| Evans David C | $39,000 | -- |
Source: Public Records
Mortgage History
| Date | Status | Borrower | Loan Amount |
|---|---|---|---|
| Previous Owner | Evans David C | $31,200 |
Source: Public Records
Tax History Compared to Growth
Tax History
| Year | Tax Paid | Tax Assessment Tax Assessment Total Assessment is a certain percentage of the fair market value that is determined by local assessors to be the total taxable value of land and additions on the property. | Land | Improvement |
|---|---|---|---|---|
| 2024 | $1,502 | $40,920 | $6,270 | $34,650 |
| 2023 | $1,499 | $40,920 | $6,270 | $34,650 |
| 2022 | $1,186 | $28,770 | $2,590 | $26,180 |
| 2021 | $1,084 | $25,060 | $2,590 | $22,470 |
| 2020 | $1,109 | $25,060 | $2,590 | $22,470 |
| 2019 | $939 | $20,410 | $2,000 | $18,410 |
| 2018 | $939 | $0 | $0 | $0 |
| 2017 | $900 | $0 | $0 | $0 |
| 2016 | $710 | $0 | $0 | $0 |
| 2015 | $725 | $0 | $0 | $0 |
| 2014 | $904 | $0 | $0 | $0 |
| 2013 | $692 | $0 | $0 | $0 |
Source: Public Records
Map
Nearby Homes