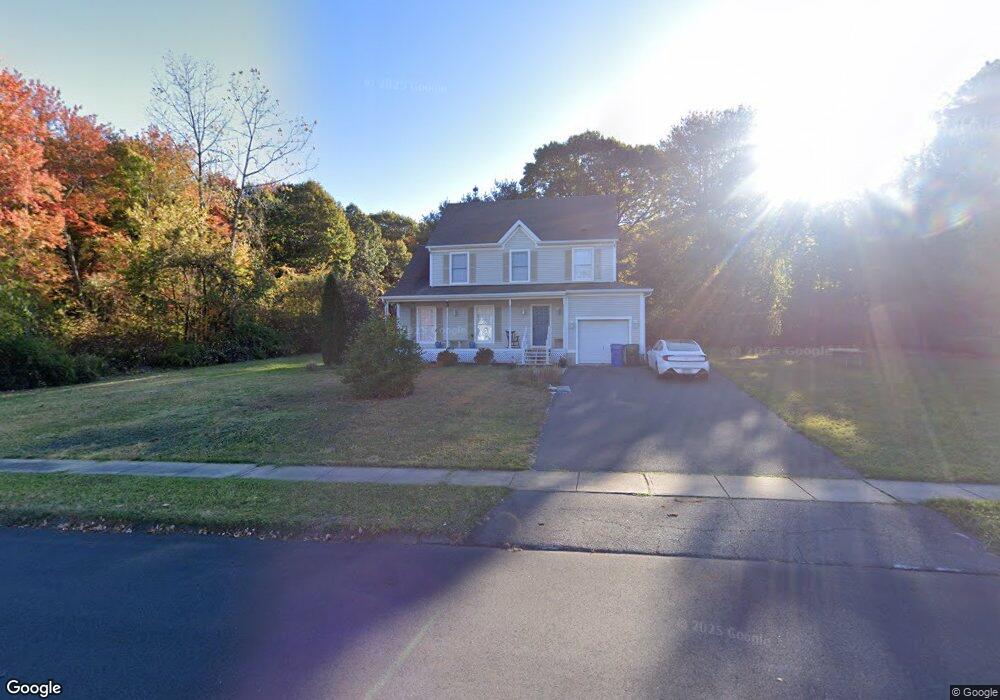
224 Russet Ln Southington, CT 06489
West Southington NeighborhoodEstimated Value: $446,087 - $550,000
3
Beds
4
Baths
1,488
Sq Ft
$334/Sq Ft
Est. Value
About This Home
This home is located at 224 Russet Ln, Southington, CT 06489 and is currently estimated at $497,272, approximately $334 per square foot. 224 Russet Ln is a home located in Hartford County with nearby schools including Urbin T. Kelley Elementary School, Joseph A. Depaolo Middle School, and Southington High School.
Ownership History
Date
Name
Owned For
Owner Type
Purchase Details
Closed on
Apr 1, 1999
Sold by
The Carriers Llc
Bought by
Porter Linda Hf
Current Estimated Value
Home Financials for this Owner
Home Financials are based on the most recent Mortgage that was taken out on this home.
Original Mortgage
$65,000
Outstanding Balance
$16,104
Interest Rate
6.78%
Estimated Equity
$481,168
Create a Home Valuation Report for This Property
The Home Valuation Report is an in-depth analysis detailing your home's value as well as a comparison with similar homes in the area
Home Values in the Area
Average Home Value in this Area
Purchase History
| Date | Buyer | Sale Price | Title Company |
|---|---|---|---|
| Porter Linda Hf | $176,687 | -- |
Source: Public Records
Mortgage History
| Date | Status | Borrower | Loan Amount |
|---|---|---|---|
| Open | Porter Linda Hf | $65,000 |
Source: Public Records
Tax History Compared to Growth
Tax History
| Year | Tax Paid | Tax Assessment Tax Assessment Total Assessment is a certain percentage of the fair market value that is determined by local assessors to be the total taxable value of land and additions on the property. | Land | Improvement |
|---|---|---|---|---|
| 2025 | $6,341 | $190,950 | $71,380 | $119,570 |
| 2024 | $6,003 | $190,950 | $71,380 | $119,570 |
| 2023 | $5,797 | $190,950 | $71,380 | $119,570 |
| 2022 | $5,562 | $190,950 | $71,380 | $119,570 |
| 2021 | $5,543 | $190,950 | $71,380 | $119,570 |
| 2020 | $5,701 | $186,130 | $72,840 | $113,290 |
| 2019 | $5,662 | $184,800 | $72,840 | $111,960 |
| 2018 | $5,633 | $184,800 | $72,840 | $111,960 |
| 2017 | $5,633 | $184,800 | $72,840 | $111,960 |
| 2016 | $5,477 | $184,800 | $72,840 | $111,960 |
| 2015 | $4,885 | $167,650 | $63,590 | $104,060 |
| 2014 | $4,755 | $167,650 | $63,590 | $104,060 |
Source: Public Records
Map
Nearby Homes