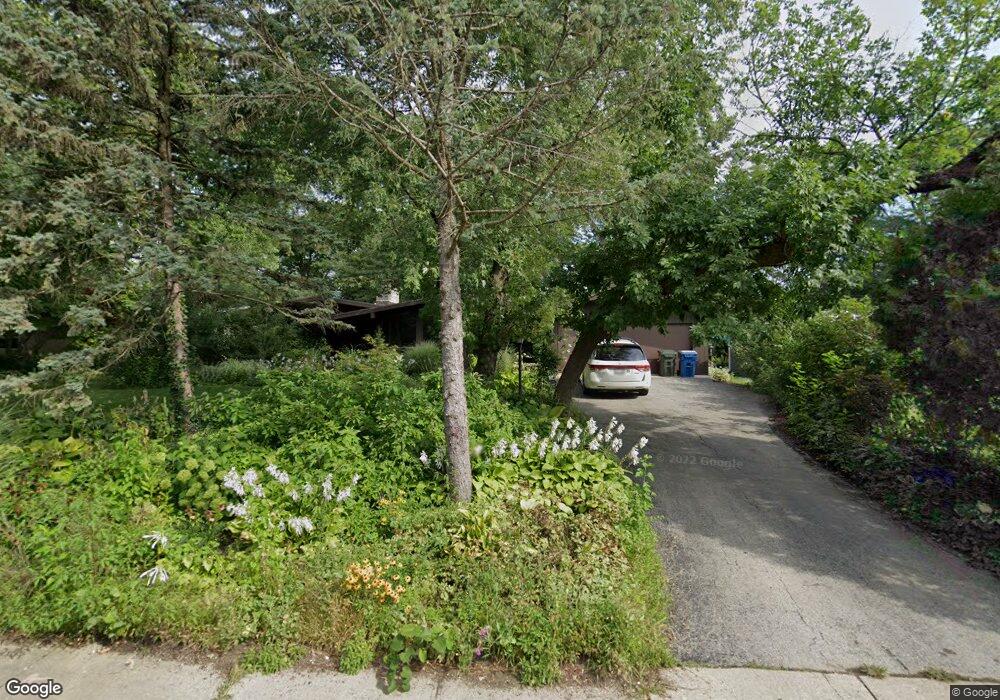
224 Shady Ln Unit 2 Downers Grove, IL 60515
North Westmont NeighborhoodEstimated Value: $612,000 - $749,000
3
Beds
2
Baths
2,401
Sq Ft
$297/Sq Ft
Est. Value
About This Home
This home is located at 224 Shady Ln Unit 2, Downers Grove, IL 60515 and is currently estimated at $712,367, approximately $296 per square foot. 224 Shady Ln Unit 2 is a home located in DuPage County with nearby schools including Highland Elementary School, Herrick Middle School, and Downer Grove North High School.
Ownership History
Date
Name
Owned For
Owner Type
Purchase Details
Closed on
Jul 12, 2011
Sold by
Wendell Matthew L
Bought by
Wendell Eric J and Wendell Corinne O
Current Estimated Value
Home Financials for this Owner
Home Financials are based on the most recent Mortgage that was taken out on this home.
Original Mortgage
$268,000
Interest Rate
4.52%
Mortgage Type
New Conventional
Purchase Details
Closed on
Sep 9, 2008
Sold by
Declar Sirovatka Arlene M and Declar Arlene M Sirovatka Self
Bought by
Wendell Matthew L
Home Financials for this Owner
Home Financials are based on the most recent Mortgage that was taken out on this home.
Original Mortgage
$240,000
Interest Rate
6.57%
Mortgage Type
Purchase Money Mortgage
Purchase Details
Closed on
Apr 17, 1998
Sold by
Cerny James J
Bought by
Self Declaration Tr Arlene M Sirovatka
Purchase Details
Closed on
Apr 18, 1995
Sold by
Kahuila Patrick S and Kahuila Helen J
Bought by
Cerny James J
Home Financials for this Owner
Home Financials are based on the most recent Mortgage that was taken out on this home.
Original Mortgage
$139,500
Interest Rate
8.42%
Create a Home Valuation Report for This Property
The Home Valuation Report is an in-depth analysis detailing your home's value as well as a comparison with similar homes in the area
Home Values in the Area
Average Home Value in this Area
Purchase History
| Date | Buyer | Sale Price | Title Company |
|---|---|---|---|
| Wendell Eric J | $335,000 | Pntn | |
| Wendell Matthew L | $300,000 | Ctic | |
| Self Declaration Tr Arlene M Sirovatka | $199,000 | -- | |
| Cerny James J | $155,000 | Attorneys Title Guaranty Fun |
Source: Public Records
Mortgage History
| Date | Status | Borrower | Loan Amount |
|---|---|---|---|
| Open | Wendell Eric J | $443,000 | |
| Closed | Wendell Corinne O | $452,000 | |
| Closed | Wendell Corinne O | $480,000 | |
| Closed | Wendell Eric J | $320,000 | |
| Previous Owner | Wendell Eric J | $268,000 | |
| Previous Owner | Wendell Matthew L | $237,000 | |
| Previous Owner | Wendell Matthew L | $240,000 | |
| Previous Owner | Wendell Matthew L | $240,000 | |
| Previous Owner | Cerny James J | $139,500 |
Source: Public Records
Tax History Compared to Growth
Tax History
| Year | Tax Paid | Tax Assessment Tax Assessment Total Assessment is a certain percentage of the fair market value that is determined by local assessors to be the total taxable value of land and additions on the property. | Land | Improvement |
|---|---|---|---|---|
| 2024 | $11,820 | $216,266 | $65,029 | $151,237 |
| 2023 | $11,244 | $198,810 | $59,780 | $139,030 |
| 2022 | $10,584 | $185,840 | $55,820 | $130,020 |
| 2021 | $8,514 | $183,720 | $55,180 | $128,540 |
| 2020 | $8,329 | $180,080 | $54,090 | $125,990 |
| 2019 | $8,008 | $172,790 | $51,900 | $120,890 |
| 2018 | $7,542 | $162,960 | $51,610 | $111,350 |
| 2017 | $5,645 | $103,980 | $49,620 | $54,360 |
| 2016 | $5,268 | $99,240 | $47,360 | $51,880 |
| 2015 | $6,136 | $109,640 | $44,560 | $65,080 |
| 2014 | $5,297 | $100,850 | $43,320 | $57,530 |
| 2013 | $5,189 | $100,380 | $43,120 | $57,260 |
Source: Public Records
Map
Nearby Homes
- 4063 Cumnor Rd
- 4003 Cumnor Rd
- 3957 Fairview Ave
- 3959 Fairview Ave
- 4111 Douglas Rd
- 3925 Williams St
- 3909 Williams St
- 4117 Sterling Rd
- Lot 3910 Sterling Rd
- 425 Sherman St
- 3105 38th St
- 3931 Liberty Blvd
- 3910 Sterling Rd
- 3811 N Park St
- 4001 N Washington St
- 3926 Glendenning Rd
- 617 Sherman St
- 301 Hambletonian Dr
- 2919 35th St
- 3806 Dillon Ct